
What if one number could tell you how scared the stock market is?
The volatility index, or VIX, does exactly that: it converts S&P 500 option prices into a single, forward-looking estimate of expected market swings over the next 30 days.
Because it comes from option demand, the VIX signals both how much uncertainty traders expect and how expensive hedging is right now.
This post explains what the VIX measures, how to read common levels, and why it matters for portfolio decisions, so you can use it as a practical risk gauge, not a crystal ball.
Core Understanding of the Volatility Index and What It Measures
The CBOE Volatility Index, known everywhere as the VIX, measures what option traders expect the S&P 500 to do over the next 30 days. The Chicago Board Options Exchange launched it in 1993, and the calculation turns collective option market pricing into a single forward looking number. It’s expressed as an annualized percentage. When the VIX reads 20, the market is pricing in roughly 20 percent annual volatility. Investors watch it because it captures real time sentiment, shows what hedging costs, and signals when fear or complacency takes over.
The VIX is forward looking. It doesn’t measure how much the market actually moved last week or last month. Instead, it reflects the prices people pay today for S&P 500 options expiring in the near future. Higher option prices mean higher implied volatility, and that pushes the VIX higher. The difference matters. Implied volatility captures expectations and uncertainty, while realized volatility measures history.
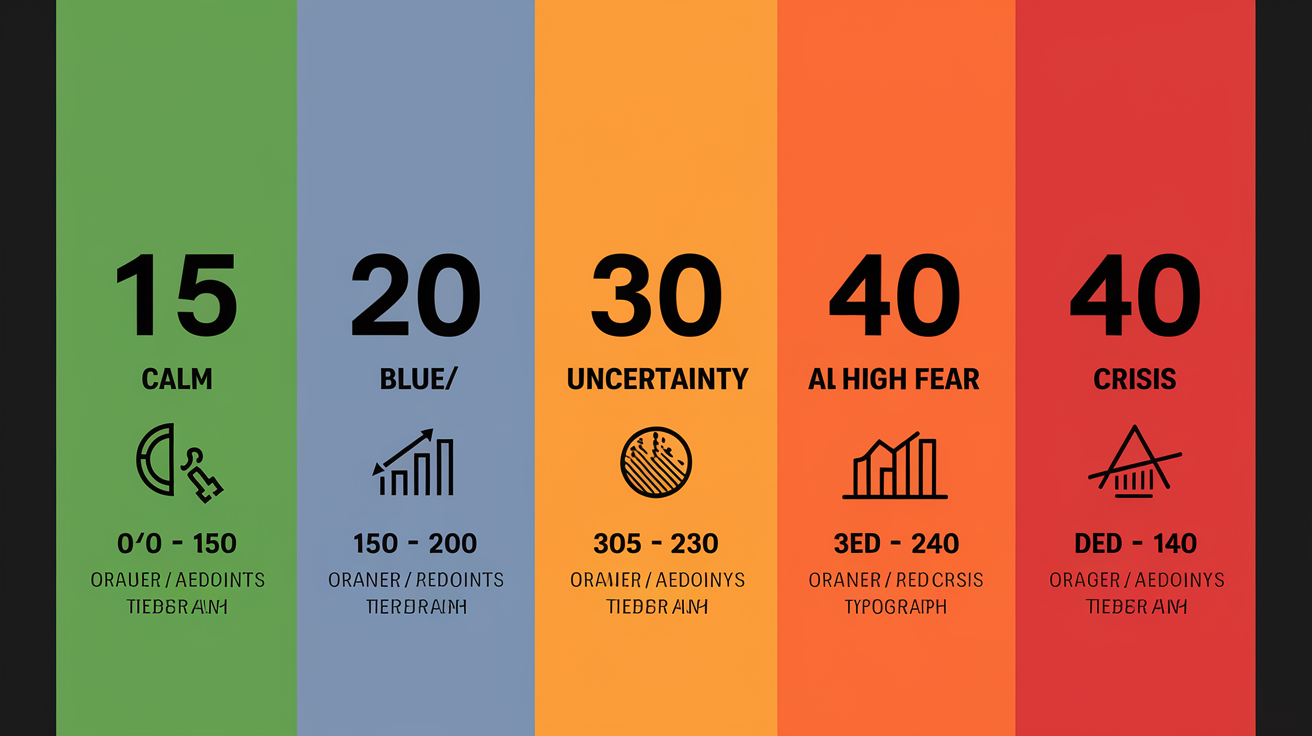
Common VIX reading ranges help you quickly gauge market conditions:
0 to 15: Very low volatility. Markets are stable, optimism is high, and option premiums are cheap.
15 to 20: Quiet to normal. Markets move but without extreme swings. This band covers much of the VIX’s long term average.
20 to 30: Moderate turbulence. Uncertainty is rising, and option demand increases as people seek protection.
30 to 40: High volatility. Stress is evident, fear is climbing, and large daily swings become common.
Above 40: Extreme crisis territory. Panic drives option prices to extraordinary levels, signaling severe market dislocations.
The VIX earned its nickname “fear index” because it spikes when traders rush to buy protective puts and calls on the S&P 500. When demand for options surges, dealers raise prices, and those higher prices feed directly into the VIX calculation. Rising VIX readings often accompany market selloffs, credit stress, geopolitical shocks, or unexpected economic data. Any event that makes investors scramble for insurance.
How the Volatility Index Works and Why It Reflects Expected Market Turbulence
The VIX derives its value from the real time pricing of S&P 500 index options. Every second, market participants trade SPX calls and puts at hundreds of strike prices, and those trades reveal how much uncertainty is embedded in near term expectations. When traders believe the market will swing more violently, they pay higher premiums for options. Those elevated premiums translate directly into a higher VIX reading. This is why the index moves minute by minute. It’s a live auction of future volatility.
To construct the index, the CBOE selects SPX options expiring between 23 and 37 days out and weights their prices across a wide range of strikes. The methodology blends the cost of calls and puts into a single estimate of what a hypothetical 30 day at the money option would imply for annualized volatility. By using two consecutive expirations and interpolating between them, the calculation stays anchored to a constant 30 day horizon even as calendar dates shift. The result is a continuous, forward looking volatility forecast that adjusts instantly to market conditions.
Volatility Index Calculation Breakdown (Simplified Method)

The official CBOE VIX calculation uses live prices from standard monthly SPX options, which expire on the third Friday of each month, and weekly SPX options, which expire every Friday. Any option must have between 23 and 37 days remaining to qualify. The process synthesizes prices from dozens of strikes into one annualized variance estimate, then converts that to a volatility index value.
Here’s the step by step sequence the calculation follows:
- Select eligible expirations: Identify the two nearest expirations that bracket the 30 day target window.
- Choose strike range: For each expiration, include all out of the money calls and puts with valid bid ask prices, plus the at the money strike.
- Calculate per option variance contribution: For each strike K, compute (ΔK / K²) × e^(RT) × Q(K), where ΔK is the spacing between adjacent strikes, R is the risk free rate, T is time to expiration in years, and Q(K) is the midpoint of the bid and ask for that strike.
- Sum contributions to total variance: Add up all the weighted option prices for each expiration to get a total variance for that maturity.
- Interpolate to 30 days: Blend the two variance numbers based on their time to expiration to produce a 30 day variance estimate.
- Take the square root: Convert variance to volatility (standard deviation).
- Multiply by 100: Scale the result to express it as a percentage point index level.
The key variables in the official formula are F (the forward index level derived from put call parity), K₀ (the first strike below the forward level), Q(K) (the option midpoint price at strike K), ΔK (strike spacing), T (time in years), and R (the risk free interest rate for maturity T). Each variable feeds into a weighted sum that captures how much premium the market demands across the entire strike spectrum.
The index uses option midpoints rather than last traded prices to avoid stale quotes. Wider strike spacing receives less weight because those far out of the money options contribute less to near term variance. The interpolation ensures the final number always reflects a 30 day window, even though actual option expirations fall on fixed calendar dates.
Values are multiplied by 100 purely for readability. Without that step, a VIX of 20 would display as 0.20, which would confuse users. Expressing it as 20 makes it instantly clear that the market is pricing 20 percent annualized volatility. This convention matches how volatility is quoted across derivatives markets and keeps the index intuitive for practitioners and reporters alike.
Reading Volatility Index Levels and What They Signal to Investors
The VIX is quoted as an annualized volatility percentage. If the index reads 18, the market expects the S&P 500 to move about 18 percent up or down over the next year, assuming a normal distribution of returns. To convert that to a 30 day expectation, divide by the square root of 12 (roughly 3.46), which gives you the one standard deviation move for the month ahead.
| Level | Meaning |
|---|---|
| Below 12 | Very low volatility. Extreme complacency or stability. Option premiums are cheap. |
| 12 to 20 | Low to normal. Calm markets with modest daily swings. Long term average sits in this range. |
| 20 to 30 | Moderate turbulence. Uncertainty rising. Investors paying more for hedges. |
| 30 to 40 | High volatility. Stress evident. Large intraday moves and elevated fear. |
| Above 40 | Crisis territory. Panic conditions. Extreme daily swings and liquidity concerns. |
Historical context helps anchor these bands. Over multi decade periods, the VIX has averaged roughly 18 to 20, though the exact figure depends on the sample window. In November 2017, the index touched an intraday low near 8.5, marking one of the calmest stretches on record. During the 2008 financial crisis, the VIX spiked above 80, with a peak close in the high 80s in late October of that year. On March 16, 2020, as the COVID-19 pandemic forced global lockdowns, the VIX closed at 82.69, the second highest daily close ever recorded.
Psychologically, the VIX acts as a real time barometer of collective investor emotion. When readings sit below 15 for extended periods, markets often feel invincible, and hedging seems unnecessary. When the index jumps above 30, fear dominates headlines, portfolio managers scramble for protection, and retail investors check their accounts more frequently. The “fear index” label captures this dynamic. Rising VIX readings don’t predict the direction of the next move, but they do signal that traders expect bigger swings and are willing to pay for insurance.
Volatility Index vs Realized Volatility: Understanding the Difference
Realized volatility measures how much the S&P 500 actually moved over a past period. It’s calculated by taking the standard deviation of daily returns over a rolling window, say, the past 30 days. This backward looking number tells you what happened, not what might happen. If the market barely budged last month, realized volatility will be low. If prices whipsawed daily, realized volatility will be high.
Implied volatility, which the VIX represents, typically runs higher than realized volatility. This gap is called the volatility risk premium. Option buyers pay extra for protection because they need certainty. Locking in a hedge today is worth more than waiting to see if a crash materializes. Option sellers collect that premium as compensation for bearing tail risk. Over long periods, implied volatility has exceeded realized volatility by several percentage points on average, meaning VIX readings tend to overstate the volatility that actually unfolds. This divergence creates basis risk. A portfolio hedge tied to the VIX may not perfectly offset equity losses because implied and realized paths can differ significantly, especially over short windows.
Volatility Index and Its Relationship to the S&P 500
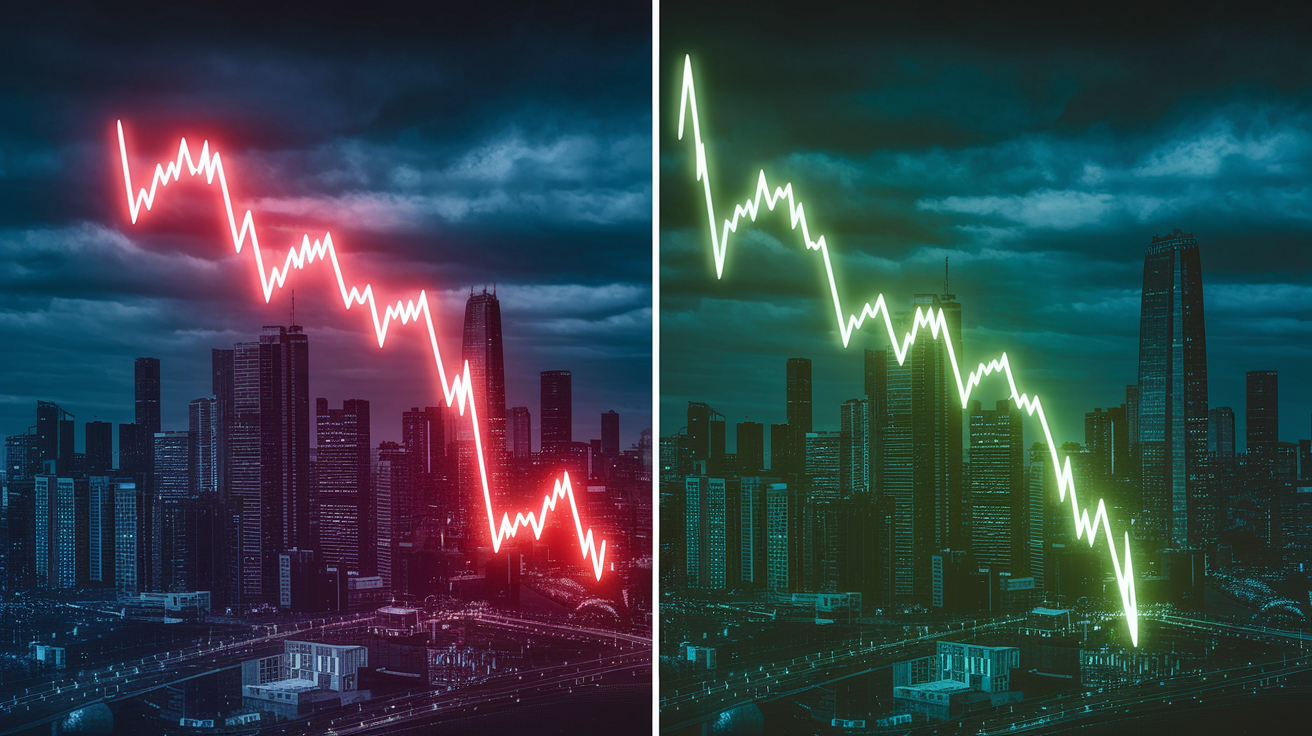
The VIX and the S&P 500 exhibit a strong negative correlation. When equity prices fall, the VIX usually rises. When stocks rally steadily, the VIX tends to decline. This inverse relationship isn’t mechanical, but it’s reliable enough that traders treat the VIX as a real time fear gauge for U.S. equities.
The pattern holds because falling stock prices increase uncertainty and prompt investors to buy protective puts. Higher put demand raises option premiums, which feeds into the VIX calculation. Conversely, during calm bull markets, hedging feels unnecessary, option premiums compress, and the VIX drifts lower. Charts plotting the two series over years show this mirror image behavior clearly. Sharp equity selloffs coincide with VIX spikes, while grinding rallies correspond to VIX lows. The relationship isn’t perfect tick by tick, but over daily and weekly intervals the negative correlation is one of the most consistent patterns in equity derivatives.
Real World Uses of the Volatility Index for Hedging and Strategy
Investors can’t buy the VIX directly like a stock or bond, but they can use VIX linked instruments to hedge equity exposure or express views on future volatility. Typical hedging allocations range from 0.5 to 5 percent of portfolio value, depending on risk tolerance and market conditions. Small positions are common because volatility hedges erode value during calm periods. You pay premium every month the market stays quiet.
Four common ways investors use the volatility index in practice:
Buying VIX call options: Gain exposure if volatility spikes. Calls expire worthless if the VIX stays low, but a crisis can deliver multiples of the initial cost.
Long VIX futures: Direct bet on rising implied volatility. Requires rolling contracts monthly, which introduces roll costs.
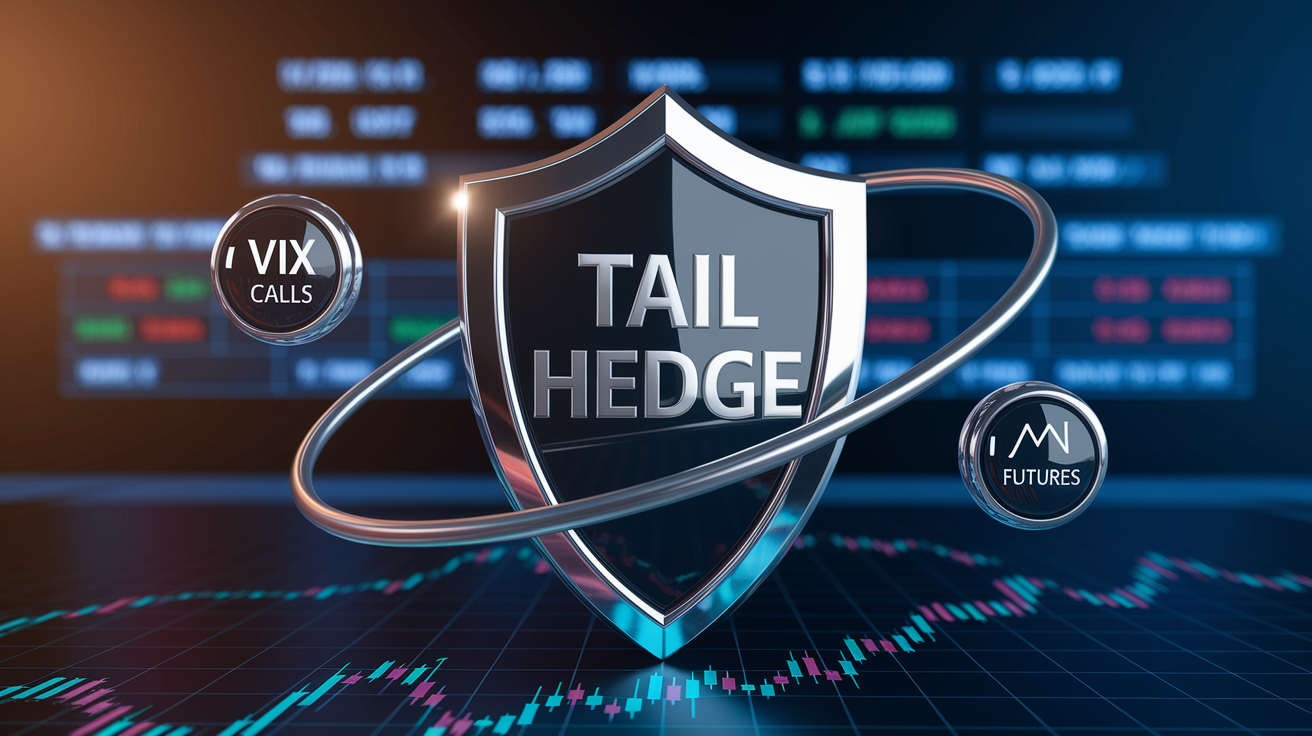
Tail risk hedging: Allocate a small percentage to out of the money VIX calls as insurance against severe market dislocations. The position loses slowly in calm times but can offset large equity drawdowns during panics.
Tactical timing signals: Use elevated VIX readings as contrarian buy signals. When fear peaks, stocks are often oversold and hedges are expensive. Classic setup for mean reversion.
These strategies come with trade offs. Hedges cost money, and during multi year bull runs those costs compound without delivering payouts. VIX instruments are also sensitive to term structure. Futures can trade above spot (contango) or below spot (backwardation), and those dynamics affect returns. Benefits include peace of mind, reduced drawdowns during crashes, and the ability to stay invested in equities knowing downside is capped.
One popular market adage summarizes contrarian VIX use: “When the VIX is high, it’s time to buy; when the VIX is low, look out below.” The first half reflects mean reversion. Extreme fear often marks short term bottoms. The second half warns that prolonged calm can precede sharp reversals when complacency builds. Neither rule is foolproof, but both capture how volatility cycles between fear and greed over time.
VIX Futures, Options, and Term Structure (Contango and Backwardation)

The spot VIX index itself isn’t tradable. To gain exposure, investors use VIX futures and options on those futures. VIX futures are monthly contracts that settle to the calculated VIX value on their expiration date, and they trade on the CBOE Futures Exchange. VIX options provide the right to buy or sell a futures contract at a specified level, adding another layer of flexibility.
Because futures represent forward expectations, the VIX futures curve often differs from the spot index. When markets are calm, near term futures typically trade above spot VIX, a condition called contango. Traders expect volatility to revert higher over time, so they price longer dated contracts at a premium. In stress environments, the curve can invert, with near term futures trading below longer dated ones, a state called backwardation. This happens when immediate fear is extreme and traders expect volatility to decline as the crisis passes.
Term structure matters enormously for volatility exchange traded products. Most VIX ETFs and ETNs hold rolling baskets of futures, not spot VIX. When the curve is in contango, these funds must sell cheaper near term contracts and buy more expensive further out contracts every month, bleeding value through negative roll yield. Over multi year calm periods, this decay can erase 80 or 90 percent of an ETP’s value even if spot VIX stays flat. Backwardation delivers positive roll, but it’s rare and short lived.
Understanding Contango vs Backwardation
Contango occurs when VIX futures prices rise as expiration dates move further out. If spot VIX is 15, the one month future might trade at 17 and the two month at 18. This upward slope reflects the market’s belief that volatility will normalize or rise from current low levels. For traders holding long VIX futures or ETPs, contango is a headwind. Every roll cycle locks in a loss as you sell low and buy high.
Backwardation is the opposite. Futures prices fall as expiration extends. Spot VIX might be 40, the one month future 35, and the two month 32. This downward slope appears during panics when immediate volatility is extreme and traders expect it to subside. Backwardation benefits long volatility positions because rolling contracts means selling high and buying low, capturing positive carry. For short volatility traders, backwardation increases risk because the curve suggests current fear may persist longer than futures imply.
Volatility Index Products: ETFs, ETNs, and How They Track VIX Exposure
Nearly two dozen VIX linked exchange traded products exist, spanning ETFs (exchange traded funds) and ETNs (exchange traded notes). None of these products holds the spot VIX. Instead, they hold rolling baskets of VIX futures, often the two nearest expirations. This structure introduces tracking error. The product’s daily return won’t match spot VIX moves, especially over longer holding periods.
ETFs are registered investment companies that own assets (futures contracts) on behalf of shareholders. ETNs are unsecured debt obligations issued by a bank, promising to pay a return linked to an index. ETNs carry credit risk. If the issuer defaults, the note can become worthless regardless of the underlying index performance. ETFs don’t have issuer credit risk, but both structures face the same roll yield problem in contango.
Three major risks when trading volatility products:
Roll decay: In contango, monthly rolls bleed value. Long VIX ETPs can lose 5 to 15 percent per month in calm markets purely from roll costs.
Tracking error: Daily rebalancing and roll mechanics cause the product to diverge from spot VIX over multi day periods. Path dependency means cumulative returns don’t match spot VIX changes.
Leverage risk: Some ETPs offer 2x or inverse exposure. Leverage amplifies both gains and losses, and daily resets compound tracking error over time.
These products are designed for short term tactical trades, not buy and hold positions. Holding a long VIX ETP for months in a calm market almost guarantees significant losses due to roll decay. Inverse and leveraged variants are even more sensitive to path and require active management.
Historical Volatility Index Patterns and Market Events
Over decades, the VIX has averaged around 18 to 20, though the exact figure varies by sample period and methodology. Readings below 12 are rare and typically occur during extended bull markets with low unemployment, stable growth, and subdued geopolitical risk. Readings above 30 signal heightened stress, and anything above 40 indicates crisis conditions.
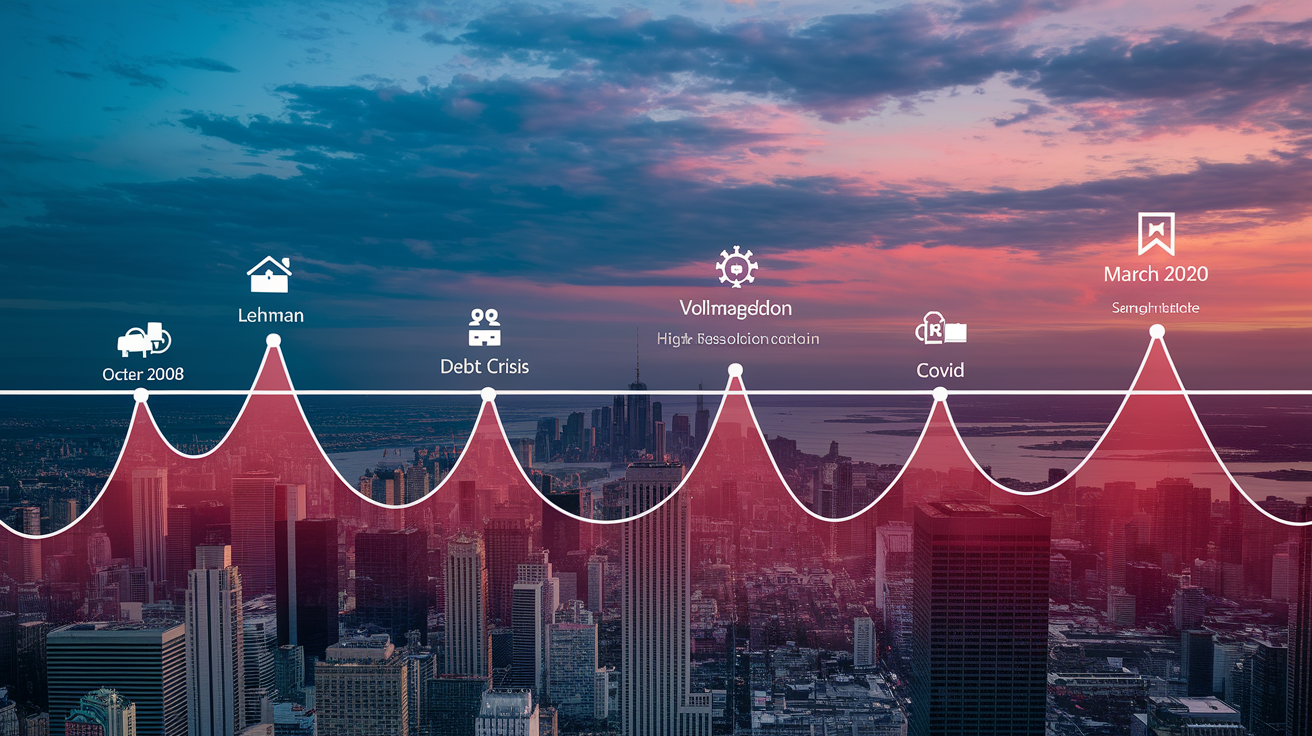
Four major historical spikes illustrate how the VIX reacts to systemic shocks:
October 2008 (Financial Crisis): The VIX surged above 80 as Lehman Brothers collapsed, credit markets froze, and equity indexes plunged. The peak close approached 90, marking the highest level ever recorded.
August 2011 (U.S. Debt Ceiling and Euro Crisis): The VIX briefly spiked above 45 as Congress fought over the debt ceiling and European sovereign debt fears escalated.
February 2018 (Volmageddon): A sudden unwind of short volatility positions sent the VIX from 15 to nearly 40 in two days, erasing billions in inverse VIX ETPs and triggering intraday circuit breakers.
March 2020 (COVID-19 Pandemic): On March 16, 2020, the VIX closed at 82.69 as global lockdowns began and uncertainty about the virus and economic impact peaked.
Volatility tends to cluster. Calm periods persist for months, then sudden spikes arrive in bursts. Once the VIX rises above 30, it often stays elevated for weeks as multiple waves of selling and hedging activity ripple through markets. This clustering reflects how fear feeds on itself. One selloff triggers margin calls, forced deleveraging, and more selling, which pushes volatility higher and extends the turbulent regime.
Canadian and Global Volatility Indices Related to the VIX
Canada has its own volatility index: the S&P/TSX 60 VIX Index. It measures 30 day implied volatility for the S&P/TSX 60, Canada’s benchmark large cap index, using options on the iShares S&P/TSX 60 Index ETF (XIU). The calculation methodology mirrors the CBOE VIX, blending call and put prices across multiple strikes and expirations to produce an annualized volatility estimate. Canadian investors use this index to gauge domestic equity risk and hedge TSX exposure.
Globally, the VSTOXX tracks implied volatility for the EURO STOXX 50, Europe’s blue chip equity index. It functions like the VIX but reflects European market sentiment. The MOVE Index measures implied volatility in the U.S. Treasury market, derived from options on Treasury futures across multiple maturities. While the VIX captures equity fear, the MOVE captures bond market uncertainty. Spikes in MOVE often coincide with rate volatility, Fed policy shifts, or credit stress. Together, these indices provide a multi asset view of global risk appetite.
Practical Examples: Converting VIX Values Into Expected Market Moves
To translate a VIX reading into an expected 30 day move, multiply the VIX level by approximately 0.289 (which is 1 divided by the square root of 12). This gives you the one standard deviation expected percentage move for the next month. For example, if the VIX is 20, the expected 30 day one sigma move is roughly 20 × 0.289 ≈ 5.8 percent. On a $100,000 equity portfolio, that translates to a potential swing of about $5,800 up or down.
| VIX Level | 30 Day Expected 1σ % Move | Example $ Move on $100k Portfolio |
|---|---|---|
| 15 | 4.3% | $4,300 |
| 20 | 5.8% | $5,800 |
| 25 | 7.2% | $7,200 |
| 30 | 8.7% | $8,700 |
Traders use this conversion to size hedges. If the VIX is 25 and you want to protect against a one sigma down move over the next month, you know you’re budgeting for roughly a 7 percent decline. A protective put at that strike might cost 1 to 3 percent of portfolio value depending on time decay and strike selection. By converting VIX to expected moves, you can weigh the cost of the hedge against the magnitude of risk you’re insuring. This math also helps set realistic expectations. A VIX of 15 implies smaller swings, so paying large premiums for deep out of the money protection may not be efficient.
Volatility Index Glossary for New Investors
Understanding the vocabulary around the volatility index makes research and trading conversations much clearer. Below are short definitions of the most important terms.
Implied Volatility: The market’s forward looking estimate of how much an asset will move, derived from option prices. Higher implied volatility means higher option premiums.
Realized Volatility: The actual historical standard deviation of an asset’s returns over a past period. Backward looking, not predictive.
Contango: A futures curve where longer dated contracts trade at higher prices than near term contracts. Common in calm markets and creates negative roll yield for long positions.
Backwardation: A futures curve where near term contracts trade above longer dated ones. Occurs during stress and delivers positive roll yield for long positions.
Tail Hedge: A portfolio protection strategy using out of the money options or VIX instruments to guard against extreme, low probability market crashes.
Variance: The square of volatility. VIX calculation starts with variance contributions from individual options, then takes the square root to express the result as volatility.
Final Words
You now have the essentials: what the VIX measures (30-day forward implied vol), how it’s derived from SPX options, typical numeric bands, and the practical tools, like futures, options and ETPs, used for hedging and signaling.
This matters because the VIX is a near-term gauge of market nervousness that helps size protection and spot tactical opportunities.
Watch the futures curve, option demand, and big spikes as your next signals.
With volatility index explained, you’re better placed to turn market fear into clearer portfolio choices.
FAQ
Q: What does the volatility index tell us?
A: The volatility index tells us the market’s expected 30‑day forward-looking implied volatility of the S&P 500, quoted as an annualized percent. Investors use it to gauge fear, option demand and hedging needs.
Q: What does a 20 VIX mean?
A: A 20 VIX means the market expects about a 5.8 percent one‑sigma move over the next 30 days (VIX × 0.289). It sits in a moderate volatility band, roughly 15–25.
Q: Is it better if the VIX is high or low?
A: Whether a high or low VIX is better depends on your goals: low VIX means calmer markets and cheaper equity carry; high VIX signals fear, higher hedging costs, and potential tactical buying opportunities.
Q: What does a 50 VIX mean?
A: A 50 VIX means the market expects roughly a 14.5 percent one‑sigma move over 30 days (VIX × 0.289). It’s an elevated, crisis‑level reading with strong hedging demand and high volatility.