
Are buybacks really the best shortcut to outperformance—or just corporate theater?
When the price slips 10–30% and cash piles up while free cash flow stays strong, buyback programs often follow, lifting EPS and giving the stock a mechanical bid.
That matters because well-funded, executed repurchases can boost short-term returns and stabilize volatility, while weak programs fizzle.
This piece shows how to spot profitable repurchase opportunities: the drivers to watch, the metrics that matter, and the execution signs that separate real catalysts from empty promises.
Key Drivers Behind a Stock Buyback Catalyst
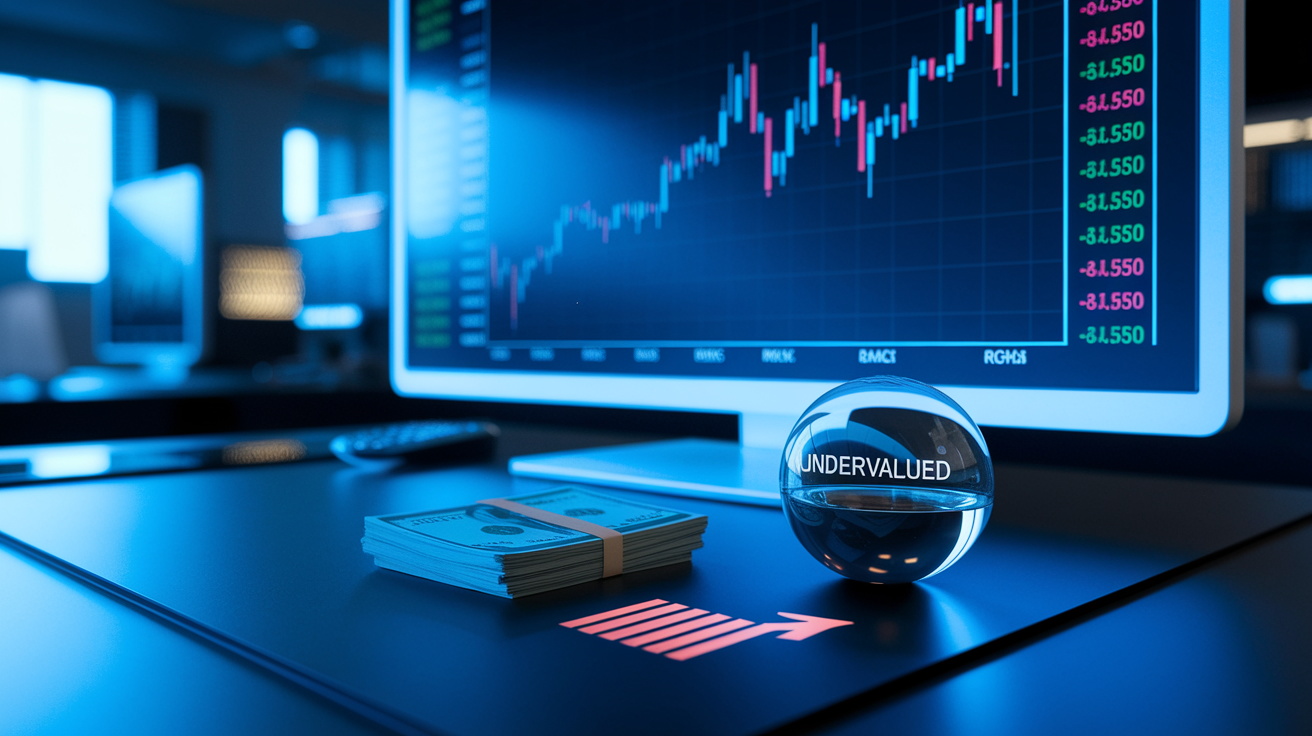
Companies launch buyback programs when measurable conditions line up. The most common trigger? Perceived undervaluation. Management typically steps in when shares trade 10 to 30 percent below recent highs or when the price to earnings multiple falls below peer medians. Another frequent catalyst is excess cash sitting on the balance sheet. Firms holding cash and short term investments exceeding 10 percent of market cap often view repurchases as an efficient way to deploy idle capital, especially when organic growth projects offer limited incremental return on invested capital.
Tax efficiency also drives buyback decisions. Repurchases let companies return capital without triggering the immediate dividend tax burden for shareholders, and they can boost earnings per share by reducing the share count. When borrowing costs are attractive, for example when investment grade corporate bond yields sit below historical averages, management may finance buybacks with debt while maintaining conservative leverage ratios. Market studies consistently show that announcements of programs larger than 1 percent of market cap produce immediate price reactions of 1 to 3 percent, with an additional 1 to 5 percent cumulative outperformance over the following one to three months.
Timing matters. Companies with free cash flow yields exceeding 5 percent and net debt to EBITDA ratios below 3 are better positioned to execute meaningful programs without balance sheet stress. When these metrics align with a sharp price decline, the buyback catalyst gains strength because the company can retire a larger percentage of shares at depressed valuations.
Common indicators that a buyback catalyst may be forming include:
- Cash balances exceeding 10 percent of market cap with minimal reinvestment opportunities
- Share price down 10 to 30 percent from 52 week highs while fundamentals remain stable
- Free cash flow yield consistently above 5 percent over the trailing four quarters
- Net debt to EBITDA below 3 and interest coverage above 4 times
- Management commentary or board authorization announcements within the past 30 to 90 days
- Peer group or sector wide increase in buyback activity signaling industry wide excess cash
How Stock Buyback Catalysts Influence Price, Liquidity, and Market Behavior
Buybacks create a mechanical lift in per share metrics. When a company retires 1 percent of its outstanding shares, earnings per share typically rise by roughly 1 percent, all else equal. That EPS accretion improves valuation ratios, price to earnings and price to book, without requiring any operational improvement. Market participants interpret large authorizations, especially those exceeding 1 to 5 percent of market cap, as a credible signal that management believes the stock is undervalued. The announcement itself often triggers short term momentum as algorithms and index rebalancing flows react to the new share count and forward estimates.
Beyond the math, buybacks inject liquidity and stabilize price action. When companies execute purchases during market dips or periods of thin trading, their bids provide a floor under the stock and smooth out volatility. This liquidity support is particularly meaningful during sharp selloffs, when institutional investors may reduce activity and retail order flow becomes erratic. The presence of a committed, well capitalized buyer, the company itself, can prevent cascading technical breakdowns and compress bid ask spreads.
| Mechanism | Catalyst Effect |
|---|---|
| Share count reduction | Lifts EPS and per share book value; improves valuation multiples without operational change |
| Management signal | Communicates confidence in intrinsic value; attracts momentum and value focused investors |
| Liquidity and price support | Provides stable bid during selloffs; reduces volatility and supports technical levels |
Types of Repurchase Programs and Their Catalyst Strength
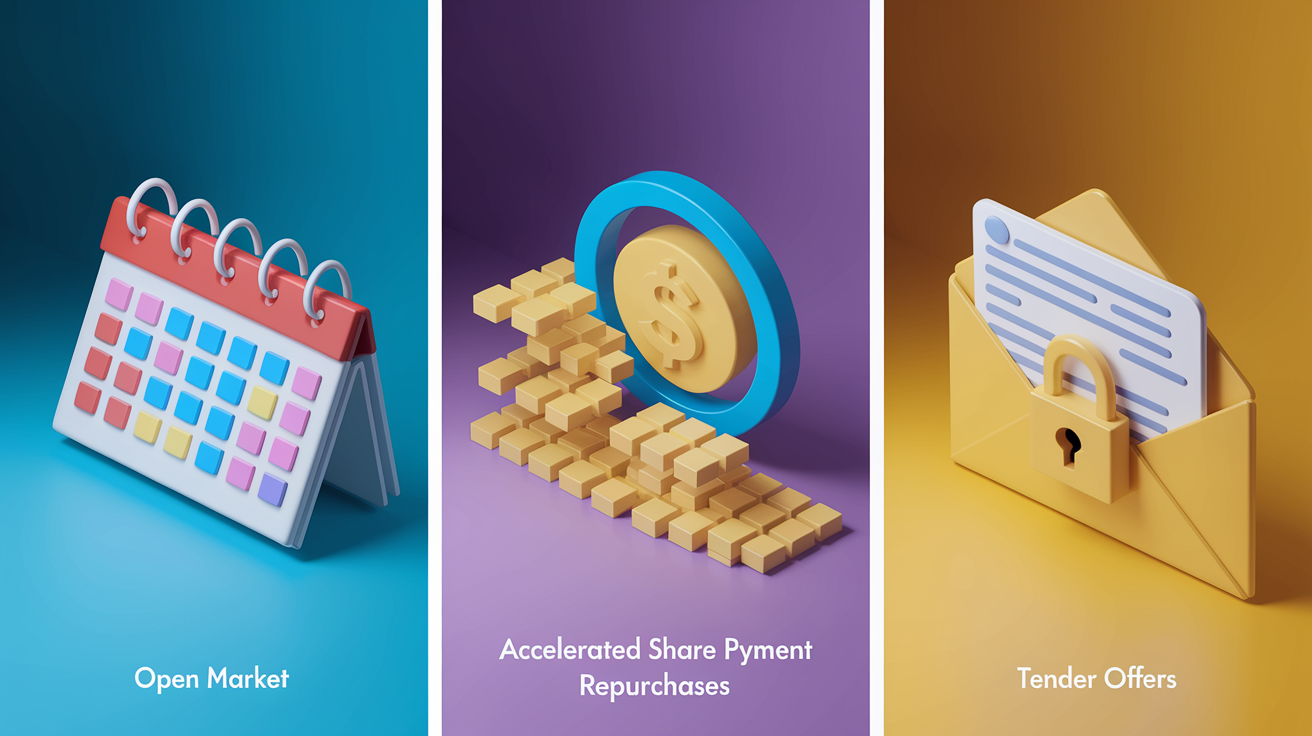
The structure of a buyback program determines how quickly and decisively the catalyst unfolds. Open market repurchases offer flexibility but signal weaker urgency. Accelerated share repurchases and tender offers lock in immediate share count reductions and produce stronger, faster price reactions. Understanding the program type helps you gauge whether the buyback will be a slow burn tailwind or a sharp near term catalyst.
Open Market Repurchases
Open market programs allow companies to buy shares gradually over time, often in daily increments that comply with volume and price limits under SEC safe harbor rules. This flexibility means management can pause or accelerate purchases based on market conditions, but it also means execution can be slow or incomplete. You should watch quarterly filings to confirm actual share retirements, because many authorized open market programs end up buying back only a small fraction of the stated amount. The signaling value is muted. Authorization doesn’t guarantee follow through. So the catalyst effect depends heavily on visible, consistent execution over multiple quarters.
Accelerated Share Repurchases
An accelerated share repurchase, or ASR, is a contract with an investment bank in which the company pays a lump sum upfront and immediately retires a large block of shares, often 80 to 90 percent of the expected total. The bank then purchases shares in the open market over weeks or months and settles any final price adjustment with the company. ASRs are common for programs exceeding one billion dollars and deliver an instant reduction in share count, making the EPS accretion visible in the next quarterly report. This immediacy creates a stronger catalyst because the market sees tangible balance sheet change and forward estimates adjust quickly.
Tender Offers
In a tender offer, the company sets a specific price and invites shareholders to sell a defined quantity of shares, typically 2 to 10 percent of outstanding stock, within a short window. Tender offers signal high conviction and urgency, because the company commits to retire shares at or above the current market price regardless of near term volatility. The clear price floor and rapid execution produce the most concentrated catalyst effect of any buyback structure. Investors often see a sharp move toward the tender price, and completion of the offer can reset valuation expectations if a meaningful percentage of shares exits the float in one event.
When evaluating buyback structure strength as a catalyst, consider these factors:
- Speed of execution. ASRs and tenders retire shares immediately; open market programs can drag over years.
- Size relative to market cap. Programs above 5 percent produce stronger reactions regardless of structure.
- Historical follow through. Check past authorizations to see if management executed more than 50 percent within 12 months.
- Funding source. Debt financed buybacks require lower leverage ratios; cash funded programs are safer.
- Disclosure specificity. Detailed timelines and pricing parameters in the announcement increase credibility and catalytic impact.
Financial Metrics That Strengthen a Stock Buyback Catalyst
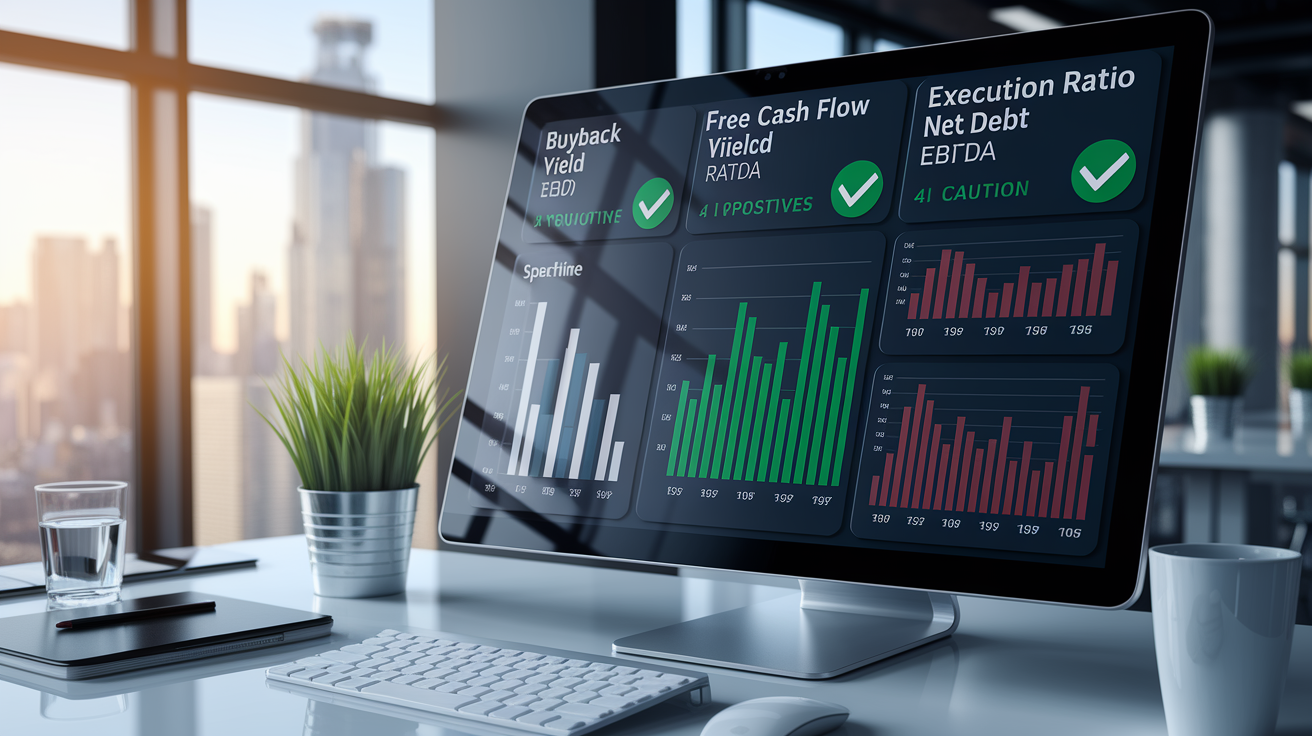
Quantitative screening separates meaningful buyback catalysts from token gestures. The most direct measure is buyback yield, calculated as trailing 12 month repurchases divided by current market cap. A buyback yield above 1.5 to 2 percent is meaningful; anything above 4 percent is strong and likely to support the stock through normal volatility. Pairing buyback yield with free cash flow yield, free cash flow divided by market cap, reveals whether the company can sustain repurchases without balance sheet strain. When FCF yield exceeds 5 percent and buyback yield sits above 2 percent, the catalyst has durable fuel.
Authorization size matters, but execution is what moves the stock. An authorization for 10 percent of shares outstanding sounds impressive, but if the company buys only 1 percent in the first year, the catalyst fizzles. Track the execution ratio: repurchases completed divided by the authorized amount over a defined period. Companies that execute more than 50 percent of their authorization within 12 months demonstrate credible commitment. Also calculate net buybacks, gross repurchases minus new shares issued for employee compensation, because heavy stock based comp can erase the benefit of gross repurchases.
Balance sheet health is the final gatekeeper. Net debt to EBITDA below 3 is a common threshold for investment grade companies; anything higher raises questions about whether the buyback is prudent or whether leverage will force a suspension during the next downturn. Interest coverage above 4 times confirms the company can service debt comfortably while funding buybacks. When these metrics align, low leverage, high free cash flow, and consistent execution, the buyback becomes a reliable, repeatable catalyst rather than a one time event.
| Metric | Investor Interpretation |
|---|---|
| Buyback yield >2% | Meaningful capital return; provides EPS accretion and supports valuation floor |
| Execution ratio >50% within 12 months | Management follows through; announcement is credible signal, not empty authorization |
| FCF yield >5% | Company generates ample cash to fund buybacks without cutting growth investment or dividends |
| Net debt/EBITDA <3 | Low balance sheet risk; buyback is sustainable even if economic conditions weaken |
Regulatory and Disclosure Factors That Shape Buyback Catalyst Timing
Buyback timing is governed by SEC Rule 10b-18, which provides a safe harbor from market manipulation claims if the company limits daily volume, avoids the opening and closing auctions, and stays at or below the highest independent bid. These constraints mean companies can’t flood the market with buy orders, so large programs take time to execute even when management is committed. You should understand that daily repurchase volume is typically capped at 25 percent of the stock’s average daily trading volume, which can stretch a billion dollar program over many months for mid cap names.
Blackout periods further compress the buyback window. Most companies suspend repurchases in the weeks leading up to quarterly earnings announcements to avoid accusations of trading on inside information. This restriction removes the company as a buyer during periods of heightened volatility around earnings, which can amplify price swings. Some firms establish Rule 10b5-1 plans, pre scheduled purchase programs that allow execution during blackouts, but these plans reduce the signaling value because the market knows the buybacks are automatic rather than opportunistic.
Key regulatory timing constraints you need to monitor include:
- Safe harbor volume limits: daily repurchases capped at 25 percent of average daily volume, slowing execution for large programs
- Blackout periods: typically 2 to 4 weeks before earnings, removing company support during volatile windows
- 10b5-1 plan disclosures: pre scheduled buybacks continue during blackouts but carry weaker signaling because they’re not reactive to price
- Debt covenant restrictions: credit agreements may limit buybacks if leverage ratios breach certain thresholds, forcing suspension mid program
Real World Examples of Strong Stock Buyback Catalysts

April 2025 marked the third highest monthly total for corporate buybacks in more than a decade, a surge that coincided with the market’s recovery from the April 7 low in the S&P 500. Companies stepped in aggressively as valuations compressed, providing liquidity and price support during a period when institutional investors had reduced activity. The rapid increase in buyback intensity, authorization and execution, helped stabilize technical indicators and contributed to the rally over the following two months. Analysts noted that the presence of corporate bids at depressed prices acted as a visible floor, reducing downside tail risk and allowing momentum to rebuild.
Technology companies led the buyback acceleration. The sector posted roughly 16 percent earnings growth in the first quarter of 2025, outpacing all other S&P 500 groups, and deployed a significant portion of free cash flow into share repurchases. The Magnificent 7, the largest technology names, accounted for nearly half of the index’s gains after the April low, a concentration supported in part by their near record buyback activity. These firms combined strong balance sheets, high free cash flow yields, and authorization programs exceeding 1 percent of market cap, creating a durable tailwind that persisted even as broader market sentiment remained uncertain.
For the full year, some analysts projected that S&P 500 companies could surpass one trillion dollars in total buybacks, potentially the highest annual figure on record. That scale of repurchase activity represented a meaningful source of demand for U.S. equities, particularly when measured against the backdrop of elevated valuations, around 21 times forward earnings at mid year. The opportunistic timing of many programs, launched or accelerated when share prices fell 10 to 30 percent from recent highs, underscored how buybacks can function as a countercyclical catalyst, with management buying aggressively during dislocations and easing off when valuations normalize.
Screening for Buyback Catalyst Candidates Using Practical Investor Criteria

An effective buyback catalyst screen starts with recency and size. Focus on companies that announced authorization programs within the past 30 to 90 days, because fresh announcements carry the strongest signaling value and are most likely to produce near term price reactions. Filter for authorization sizes exceeding 1 to 3 percent of market cap; smaller programs rarely move the stock in a meaningful way. Cross reference the authorization with actual repurchase history. Companies that executed more than 50 percent of prior authorizations within 12 months are far more likely to follow through on the new program.
Pair authorization data with valuation and cash flow metrics. Target stocks trading at least 10 to 30 percent below their 52 week highs or with price to earnings ratios below sector medians, because management typically launches buybacks when it perceives undervaluation. Require a free cash flow yield above 5 percent and a buyback yield, trailing 12 month repurchases divided by market cap, above 1.5 percent. Check the balance sheet: net debt to EBITDA should sit below 3 and interest coverage above 4 times to ensure the company can sustain the program without financial stress. Look for insider buying or recent board authorizations in 8-K filings, which often precede public announcements and signal internal confidence.
Actionable screening criteria to detect strong buyback catalyst candidates:
- Recent authorization announced within the past 30 to 90 days, ideally disclosed in an 8-K or press release
- Program size exceeding 1 to 3 percent of current market cap, with larger authorizations (above 5 percent) preferred
- Trailing 12 month buyback yield above 1.5 percent; above 2 percent is more compelling
- Free cash flow yield above 5 percent over the past four quarters, confirming cash generation
- Net debt to EBITDA below 3 and interest coverage ratio above 4 times, indicating low leverage risk
- Execution history showing more than 50 percent of prior authorizations completed within 12 months
- Share price down 10 to 30 percent from 52 week high or trading below peer group median P/E
- Minimal share dilution from compensation: net buybacks (repurchases minus issuance) should be positive
- Insider buying activity or recent board governance changes that signal alignment with shareholder value
Case Study: Evaluating an Undervalued Company’s Buyback Catalyst Potential

InFocus Corporation offers a clear example of how to model a buyback catalyst when a company holds significant excess cash and trades well below liquidating value. The company had 40.7 million shares outstanding and roughly 55 million dollars in cash and equivalents, with no debt. Management authorized a repurchase program for up to 4 million shares over three years, approximately 9.8 percent of the outstanding float, but actual execution through September 30 was only 50,000 shares at an average price of 1.53 dollars. The stock closed at 0.67 dollars, roughly 70 percent below the estimated per share liquidating value of 1.15 dollars before any additional buyback.
Modeling a more aggressive scenario shows the catalyst power. If management executed a 50 percent buyback, repurchasing 20 million shares at the current price of 0.67 dollars, the cost would total 13.4 million dollars. After the buyback, cash would fall to approximately 42 million dollars, but the share count would drop to 20.7 million. Dividing the remaining cash by the new share count lifts the per share liquidating value from 1.15 dollars to 1.61 dollars, a 40 percent increase in tangible value per share. That accretion demonstrates why buybacks are often the lowest risk use of excess cash for deeply undervalued companies: every dollar spent retires shares at a steep discount to intrinsic value, mechanically boosting what each remaining share represents.
| Scenario Input | Value |
|---|---|
| Shares outstanding (before buyback) | 40.7 million |
| Cash available (before buyback) | $55 million |
| Shares repurchased at $0.67 | 20 million (cost: $13.4 million) |
| Per share liquidating value (after buyback) | $1.61 (vs. $1.15 before) |
The case illustrates two critical lessons. First, authorization size matters less than execution. InFocus authorized 4 million shares but bought only 50,000, making the catalyst irrelevant in practice. Second, when a stock trades at a significant discount to cash per share and management commits to meaningful repurchases, the buyback can deliver predictable, low risk value creation even if operating performance remains flat. Investors screening for buyback catalysts should prioritize companies with large cash balances, minimal debt, deep undervaluation, and a credible track record of following through on authorizations. Exactly the combination that turns a buyback from a press release into a real driver of per share wealth.
Final Words
Right in the action: we mapped the main triggers—undervaluation, excess cash, tax motives and management signaling—and why structure and timing change how forceful a repurchase can be.
We also covered price mechanics, EPS effects, regulatory timing, real-world examples, a screening checklist, and a case study to model impact.
If you want to spot opportunities, focus on buyback yield, authorization size, FCF coverage and execution—these are the nuts-and-bolts of a stock buyback catalyst. Stay curious; disciplined screens and checklists help these moves support your portfolio.
FAQ
Q: Is a stock buyback a good thing?
A: A stock buyback can be positive when it signals undervaluation and strong cash flow, but its benefit depends on size, funding source, and execution; check buyback yield and balance-sheet strength.
Q: What does a catalyst mean in stocks?
A: A catalyst in stocks is an event that changes investor expectations and price—examples include buyback announcements, earnings, or policy moves; catalysts matter because they shift valuation, liquidity, or sentiment.
Q: What is the future outlook for catalyst?
A: The future outlook for catalysts is that buyback activity should stay meaningful as companies with excess cash and cheap borrowing repurchase shares; watch authorization sizes, execution pace, and sector concentration for confirmation.
Q: Do I lose my shares in a buyback?
A: You don’t lose your shares automatically; a buyback retires shares the company buys on the market. You keep your holdings unless you sell, while total outstanding shares and EPS often change.