
What if the biggest stock moves aren’t luck but the result of clear, trackable catalysts?
Most traders chase headlines and miss the real signals; the edge comes from spotting scheduled events, SEC filings, sector shifts, and early chatter before volume and volatility spike.
This post lays out a six-step, repeatable playbook, from calendars to EDGAR scans to screeners, that helps you find catalysts early, judge whether they’ll move a stock, and decide how to size or time a position.
Start here if you want fewer surprises and clearer timing.
Core Methods to Identify Stock Catalysts Before They Move Prices

A stock catalyst is any event or piece of information that triggers a measurable price move. You’ll know it’s real when you see volume and volatility spike. Volume tells you how many shares are changing hands. Volatility shows you how fast the price is actually moving. Without both, even big announcements tend to fizzle out before they create anything tradeable. Take Deere’s Q3’20 earnings, when they posted $2.57 per share against an estimate of $1.30. The stock jumped roughly 16.2 percent because volume and volatility both exploded as traders absorbed the surprise.
Catalysts come in two flavors: hard and soft. Hard catalysts are direct company events like earnings, management shake-ups, federal investigations, or M&A deals. Soft catalysts are external forces, things like new legislation, pandemics, or government orders that reshape entire sectors at once. Zoom proved how powerful soft catalysts can be when stay-at-home mandates drove the stock up 569 percent in a single year. Spotting these early gives you an edge because most of the price action happens in the hours or days right after news breaks, before everyone else catches on.
You can find catalysts through scheduled sources and real-time feeds. Investors who watch financial calendars, regulatory filings, earnings schedules, news aggregators, social media, and screening tools get advance notice of events that might move prices. These channels run on different timescales, so combining them increases your odds of catching something before the crowd does.
Here’s a systematic six-step approach to finding stock catalysts:
-
Review financial and event calendars every day to track scheduled earnings, FDA decision dates, M&A windows, and government vote schedules.
-
Scan SEC filings on EDGAR. Focus on Form 8‑K for material events, S‑1 for IPOs, and 13D/13G for activist or billionaire stakes.
-
Monitor earnings schedules and analyst actions to catch pre-earnings press releases, upgrades, or downgrades that often trigger immediate moves.
-
Use news aggregators and set real-time alerts on major newswires and niche industry sites to capture breaking developments.
-
Follow social media feeds on Twitter and real-time platforms for early mentions, then verify everything to avoid rumor spikes or mistaken-identity trades.
-
Configure stock screeners to filter by daily volume, float, recent percentage gainers, new highs, and sector momentum. Set alerts for press releases and insider filings.
Stock Catalyst Categories Investors Must Track

Hard catalysts produce quick reactions because they’re tied directly to the company. An earnings report, a major contract signing, or the departure of a CEO delivers new financial or strategic information that portfolio managers price in right away. Soft catalysts operate at the sector or economy level and may take days or weeks to work their way into share prices. Marijuana legalization in Canada during 2018 pushed Aurora Cannabis from around five dollars in August to over twelve dollars as investors anticipated industry-wide revenue growth. The Farm Bill passage in late 2018 had a similar effect on CBD and hemp-related names because the regulatory change opened new revenue channels across the entire sector.
Catalyst duration varies widely. A mistaken-identity spike might reverse in hours once traders realize the company isn’t connected to the headline. In December 2014, the Herzfeld Caribbean Basin Fund jumped from seven dollars to fifteen dollars in four days because participants confused the ticker CUBA with news about Cuba reopening. Then it collapsed when the error became clear. But regulatory approvals or large partnership deals can sustain momentum for weeks as fundamental analysts incorporate the new information into earnings models and price targets.
Sector-wide catalysts often overshadow company-specific ones because they shift capital flows at the index level. When central banks signal rate cuts, growth sectors rally no matter what individual earnings look like. When pandemic restrictions tighten, delivery and e-commerce stocks move together. Recognizing whether a catalyst is company-specific or sector-wide determines position sizing and how long you plan to hold.
Seven common catalyst types show up repeatedly in market data:
-
Earnings reports and guidance changes that beat or miss consensus expectations and alter forward revenue or margin forecasts.
-
Mergers, acquisitions, and strategic partnerships that create synergies, expand market access, or consolidate competitors.
-
Regulatory events such as FDA approvals, breakthrough therapy designations, patent grants, or new compliance mandates.
-
Product launches and commercialization announcements including licensing deals, manufacturing contracts, or major retail placements.
-
Analyst upgrades and downgrades that shift institutional sentiment and trigger price-target revisions.
-
Activist investor or billionaire stake disclosures that signal potential restructuring, capital returns, or management changes.
-
Clinical trial results and FDA milestones in biotech, including Phase data, safety reviews, and approval decision dates.
Using SEC Filings and EDGAR to Find Hidden Stock Catalysts

SEC filings often reveal catalysts hours or even days before news outlets publish stories. Corporate executives must file material events, insider transactions, and significant financial changes within strict deadlines, creating a public record you can scan before the information reaches wider audiences. Monitoring these filings systematically uncovers leadership transitions, restructurings, financing deals, large contracts, and risk-factor disclosures that can move share prices when the market digests them.
Certain filings signal immediate or near-term catalysts. Form 8‑K discloses unscheduled material events like executive departures, asset acquisitions, or bankruptcy filings. Form S‑1 announces IPO registration and provides the first public look at a private company’s financials and business model. Forms 13D and 13G report activist or institutional stakes above five percent, often preceding proxy battles or restructuring announcements. Forms 10‑Q and 10‑K contain quarterly and annual disclosures, and reading the risk-factor sections can reveal operational challenges or regulatory threats before they escalate into public crises. Form 144 filings show planned insider sales, which may come before negative news or signal that executives expect weaker performance.
| Filing Type | Catalyst Signal |
|---|---|
| 8‑K | Material events: executive changes, asset sales, major contracts, bankruptcy filings |
| S‑1 | IPO registration: first public financial disclosure, business-model reveal, lockup periods |
| 13D / 13G | Activist or institutional stakes above 5 percent: potential for proxy fights, restructuring, or capital returns |
| 10‑Q / 10‑K | Quarterly and annual reports: updated risk factors, guidance, segment performance, legal contingencies |
| 144 (Insider Sale) | Planned insider sales: may precede negative news or signal weaker outlook from management |
Market Calendars and Scheduling Tools for Catalyst Discovery

Scheduled events create predictable windows for price movement, so you can prepare positions, adjust risk, or stand aside before volatility arrives. Earnings calendars list quarterly, half-year, and annual result dates, often weeks in advance. Economic calendars track central-bank interest-rate decisions, employment reports, inflation data, and GDP releases that influence entire sectors or asset classes. Dividend calendars show ex-dividend and payment dates, which can trigger short-term price adjustments. Clinical and FDA calendars are crucial for biotech traders because approval decisions or Phase-result announcements produce some of the largest single-day moves in equities.
Planning around scheduled events reduces the chance of being surprised by sudden moves. When a central bank signals a rate decision, growth stocks and interest-sensitive sectors adjust in the days leading up to the announcement. A trader who monitors the economic calendar can reduce exposure before the event or add positions in sectors that historically benefit. Biotechs with upcoming FDA decision dates often see volume and volatility rise in the week before the announcement, creating both opportunity and risk depending on the outcome.
Biotech traders lean heavily on FDA and clinical calendars because drug approvals, breakthrough-therapy designations, and trial-data releases can move small-cap stocks by triple-digit percentages in a single session. An example from the source material cited a biotech receiving a breakthrough-therapy designation that triggered a sharp spike. These events are published on FDA calendars and clinical-trial databases, giving you advance notice to monitor chart setups and volume thresholds before the announcement.
Five calendar types to monitor daily:
-
Earnings calendars with confirmed release dates for quarterly, half-year, and annual results across all sectors.
-
Economic calendars listing interest-rate decisions, jobs reports, inflation prints, manufacturing data, and other macro releases.
-
Dividend calendars showing ex-dividend and payment dates for income-focused positions and short-term price adjustments.
-
Clinical and FDA calendars tracking drug-trial results, approval decision dates, and regulatory meetings for biotechs.
-
M&A and corporate-action calendars highlighting shareholder votes, spin-off dates, ticker changes, and merger closings.
News Aggregators and Real-Time Alerts to Track Stock Catalysts Fast

News aggregators compile press releases, regulatory filings, and breaking stories from multiple sources into a single feed, cutting down the time you’d spend identifying catalysts manually. Real-time alerts notify you the moment a company publishes earnings, announces a deal, or issues a press release, often before the information appears in mainstream financial media. Traders who configure alerts for specific tickers, sectors, or keywords can react to catalysts while volume is still building rather than chasing moves after prices have already spiked.
Aggregators speed discovery but they don’t eliminate the need for confirmation. A press release may announce positive news, yet if volume stays low or the chart shows no breakout, the catalyst may not have enough market interest to produce a tradeable move. You should treat aggregator alerts as early signals that require validation through price action, volume spikes, and technical patterns before committing capital. The source material stressed that news acts as backup confirmation for technical setups, not as the sole reason to enter a position.
To set up effective real-time alerts, configure these five alert types:
-
Ticker-specific press-release alerts that notify you immediately when a company files an 8‑K, issues guidance, or publishes trial results.
-
Sector or industry keyword alerts that trigger on terms like “FDA approval,” “merger,” “contract win,” or “earnings beat” across a defined watchlist.
-
Volume-spike alerts that flag when daily volume exceeds a multiple of the twenty-day average, indicating unusual interest.
-
Price-breakout alerts that fire when a stock moves above resistance, below support, or records a new high or low.
-
Insider-transaction alerts that track Form 4 filings for buys or sells by executives and large shareholders, signaling potential near-term developments.
Social Media and Community Scanning for Early Catalyst Signals

Social media platforms surface company news, product updates, and executive commentary ahead of official announcements because employees, customers, and insiders often share information casually before press releases are issued. Twitter remains a primary channel for real-time catalyst discovery, with company accounts, government officials, and traders posting updates that can move stocks within minutes. Reddit and StockTwits communities amplify catalyst-driven moves by sharing due diligence, screenshots, and speculation, which can drive additional volume even if the underlying catalyst is weak.
Risks come with social-media signals because rumors, mistaken identities, and coordinated pumps create false catalysts that reverse quickly. A historical example involved the Herzfeld Caribbean Basin Fund, which traded under the ticker CUBA. In December 2014, when news broke about the United States reopening relations with Cuba, the fund’s shares surged from seven dollars to fifteen dollars in four days as participants mistakenly assumed the ticker was directly tied to Cuban assets. Once the confusion cleared, the stock fell back. Social media can amplify speculation around biotech names or small-caps without verifying whether clinical data or regulatory milestones are truly imminent.
Verification steps reduce the chance of acting on false catalysts. Cross-reference social-media mentions with SEC filings, press releases, or reputable newswires. Check the account posting the information for credibility. Official company accounts and verified executives carry more weight than anonymous profiles. Confirm that volume and price are responding to the catalyst. If the stock isn’t moving despite heavy chatter, the catalyst may lack substance. Finally, review the chart to ensure that the move aligns with technical patterns rather than appearing as an isolated spike with no support.
Six signal types to monitor on social media:
-
Product-launch announcements or feature releases shared by company accounts before formal press releases.
-
Executive commentary on earnings, strategy, or partnerships posted on Twitter or LinkedIn.
-
Customer complaints or praise that reveal operational issues or demand trends ahead of official disclosures.
-
Regulatory updates from government agencies or industry groups that affect entire sectors.
-
Mistaken-identity tickers where symbol confusion drives short-lived spikes unrelated to the company’s fundamentals.
-
Community due diligence on Reddit or StockTwits that uncovers overlooked filings, insider buys, or contract wins.
Screening Tools to Detect Stocks With Potential Catalysts

Stock screeners filter thousands of tickers by criteria like volume, volatility, float, percentage change, and price, isolating names that show catalyst-driven behavior before the broader market recognizes them. A surge in volume relative to the trailing average often signals that news has broken or that informed participants are positioning ahead of an announcement. Micro-cap stocks have produced intraday moves of 700 to 800 percent in recent history when catalysts align with low float and high short interest, demonstrating the power of screening for unusual activity.
Options scanners track open interest and volume in call or put contracts, revealing unusual positioning that may come before earnings, approvals, or other scheduled events. A sudden spike in call open interest at a specific strike price can indicate that traders expect upward movement, while concentrated put activity may signal hedging or bearish sentiment. When options volume exceeds the trailing average by multiples, the event is likely known or anticipated by a subset of participants, giving screener users a window to investigate the catalyst before it becomes public.
Five screening filters to configure for catalyst discovery:
-
Daily volume versus twenty-day average: flag stocks trading at least twice the recent baseline to catch early catalyst interest.
-
Percentage gainers and losers: screen for names up or down more than five percent intraday to identify breaking news or surprise events.
-
Float under fifty million shares: low-float stocks amplify catalyst-driven moves because limited supply meets sudden demand.
-
New fifty-two-week highs or lows: these levels often coincide with fundamental changes or sector rotations that act as catalysts.
-
Unusual options volume and open interest: filter for contracts where volume exceeds open interest or where open interest has doubled in one session, signaling event positioning.
Evaluating the Strength and Probability of a Stock Catalyst

A strong catalyst produces an immediate, measurable volume spike compared to the stock’s trailing average. When Deere reported earnings with a significant beat, volume surged as institutional desks repriced the shares and retail traders entered breakout positions. Float size determines how much buying pressure is required to move price. A catalyst affecting a fifty-million-share float will generate larger percentage moves than the same catalyst on a five-hundred-million-share float. Short interest amplifies catalyst impact when the news is positive, forcing short sellers to cover and adding buy-side pressure. Sector momentum matters because a catalyst in a hot sector attracts more attention and capital than the same catalyst in a dormant industry.
Directness measures how tightly the catalyst ties to the company. A hard catalyst like an earnings beat or FDA approval directly changes the company’s financial outlook, producing sustained moves. A soft catalyst such as a sector-wide regulatory change or macroeconomic event may lift the stock but can reverse when the broader trend fades. You should assess whether the catalyst affects only the target company or an entire peer group, then adjust position size and holding period accordingly.
Multi-catalyst stacking generates the largest moves when several factors align at once. An example from the source material described Blue Apron in January 2020. The stock rose from two dollars to twenty-nine dollars in four days because pandemic-related demand, a low float, and high short interest converged. The combination created a feedback loop where each catalyst reinforced the others, producing a move that no single catalyst could have generated alone. When screening for opportunities, prioritize setups where at least two or three catalysts stack, especially when one is a hard catalyst and another creates structural pressure like a short squeeze or supply constraint.
Combining Technical Analysis With Catalyst Identification
Catalysts alone don’t define entry or exit points. A positive earnings report may arrive while the stock is overbought, extended from moving averages, or facing resistance at a prior high, reducing the probability of a sustained move. A catalyst that breaks the stock above a consolidation pattern with strong volume and broad participation often signals the start of a multi-day trend. Confirming catalyst-based setups with chart patterns, time-of-day rules, and volume thresholds prevents you from chasing headlines into unsustainable spikes.
Many active traders require a stock to trade at least a couple hundred thousand shares intraday before entering a position, ensuring sufficient liquidity to exit without slippage. A common rule limits position size to one percent of the stock’s average daily volume, so a stock trading one million shares allows a maximum position of ten thousand shares. Stops are placed below recent support or a percentage threshold like three to five percent from entry, and traders exit immediately if volume collapses or the catalyst is contradicted by subsequent news.
Technical Confirmation Steps
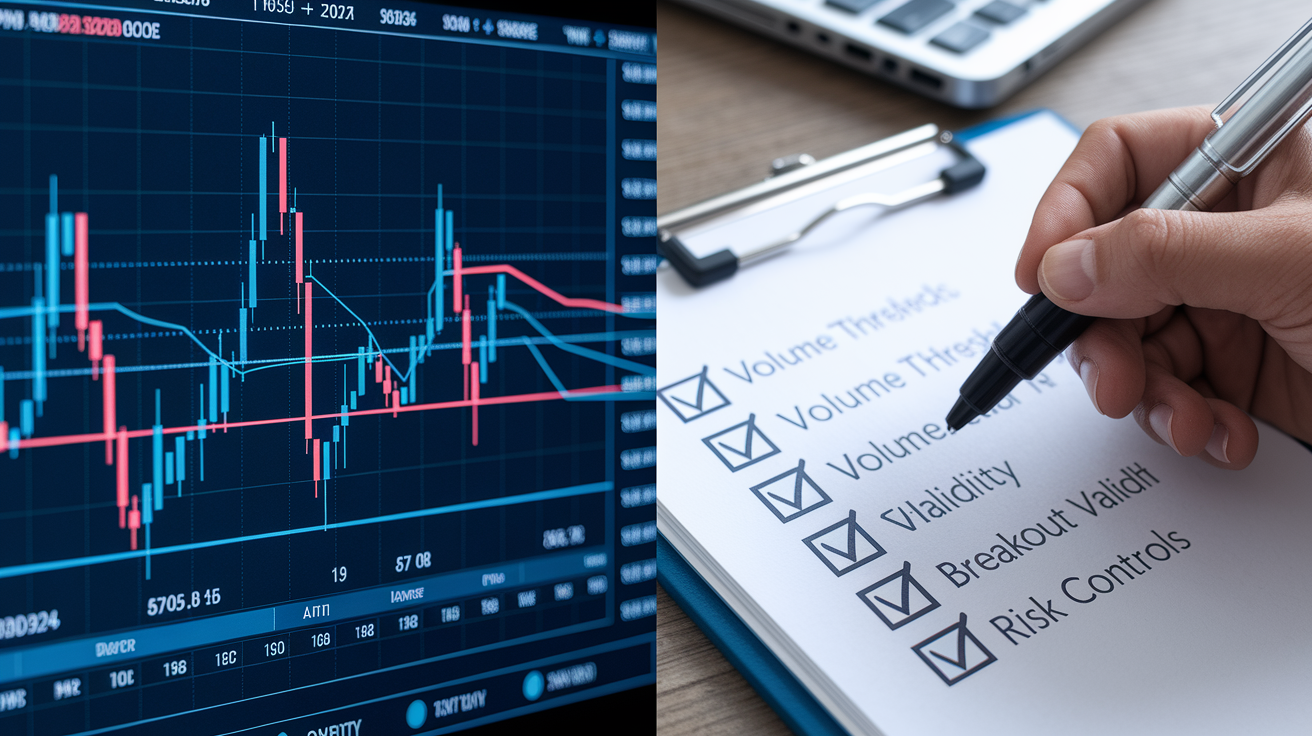
Follow these four rules to confirm catalyst-based setups before committing capital:
-
Volume threshold check: Verify that the stock is trading at least twice its twenty-day average volume and that the increase began when the catalyst was announced, not before.
-
Breakout or breakdown confirmation: Wait for the stock to break above resistance or below support on the catalyst news, confirming that the market is repricing the shares rather than fading the move.
-
Price and moving-average alignment: Make sure the stock isn’t overextended from its short-term moving averages. Catalyst entries work best when the stock is near or just breaking a consolidation zone.
-
Risk-control placement: Set a stop loss below the most recent swing low or intraday support, and size the position so that a stop-out doesn’t exceed one to two percent of portfolio equity.
Building and Maintaining a Catalyst Watchlist

A catalyst watchlist consolidates tickers that have upcoming scheduled events, recent filings, or unusual volume patterns into a single reference you can review daily. Traders use watchlists to monitor early trends, track repeated catalysts, and avoid missing opportunities in names that move quickly. Platform tools on brokerages and charting software allow custom lists with alerts, making it simple to receive notifications when a stock on the watchlist hits a volume threshold, price level, or news release. TraderTV partners publish watchlists twice daily, illustrating the real-world cadence of maintaining and updating catalyst-focused lists.
Maintenance frequency depends on trading style. Day traders refresh watchlists every morning and adjust throughout the session as new catalysts surface. Swing traders review watchlists each evening, adding names with earnings scheduled for the next few days or SEC filings that hint at upcoming announcements. Calendar integration ensures that no scheduled event is overlooked. Linking earnings dates, FDA decisions, and economic releases directly into the watchlist keeps all catalyst sources synchronized in one workflow.
Five components to include in a catalyst watchlist:
-
Ticker symbols and current price with percentage change from the prior close to spot intraday catalyst reactions.
-
Scheduled event dates for earnings, FDA approvals, dividend payments, or shareholder votes tied to each ticker.
-
Volume and float data to assess liquidity and the potential magnitude of catalyst-driven moves.
-
Recent SEC filing links for 8‑K, 13D, or Form 4 disclosures that may signal upcoming catalysts or insider sentiment.
-
Alert triggers for volume spikes, price breakouts, or news releases, ensuring immediate notification when the catalyst activates.
Final Words
We ran through hands-on methods for spotting catalysts: what they are, hard vs soft events, SEC filings, calendars, news feeds, social scans, screeners, and technical confirmation.
That matters because volume and volatility confirm moves, multi-catalyst stacks raise odds, and the right rules limit losses while sharpening entries.
Use this checklist as your routine for how to find stock catalysts — set alerts, verify filings, watch volume, and size positions to your risk. Keep at it; the process makes better decisions more likely.
FAQ
Q: What is the 3-5-7 rule in stocks?
A: The 3-5-7 rule in stocks is a loose trader shorthand, not a formal rule. Common uses include staged buys on 3%, 5%, 7% pullbacks or layering by timeframes (3 days, 5 weeks, 7 months).
Q: What are catalysts for a stock?
A: Stock catalysts are events or new information that move prices. Typical examples: earnings, M&A, FDA/regulatory decisions, product launches, analyst actions, macro data, and insider activity—confirmed by volume and volatility.
Q: What to invest $1000 into right now?
A: Investing $1,000 right now depends on your horizon and risk tolerance. Consider a low-cost diversified ETF, fractional shares of quality stocks, short-term bond funds, or dollar-cost averaging to lower timing risk.
Q: What is the tiny $3 AI stock?
A: The tiny $3 AI stock usually refers to a micro-cap around $3 claiming AI exposure; there’s no single stock. Check revenue, customers, SEC filings, liquidity, and expect high volatility and promotional risk.