
Is Tesla’s earnings beat more mirage than momentum?
The company reported EPS of $0.50 and $24.9 billion in revenue, yet net income fell 17 percent and shares slipped after the release.
That mix, with better gross margins but lower profit and a planned > $20 billion in 2026 capital spending, matters because it pressures near‑term cash flow and shifts the story toward AI and robotics.
This intro shows what the numbers mean for your portfolio and what to watch next: deliveries, free cash flow, and CapEx execution.
Key Financial Highlights Snapshot

Tesla’s Q4 2025 results gave investors plenty to chew on. The company posted earnings per share of $0.50, beating analyst estimates of $0.45 by about 11 percent, while revenue hit $24.9 billion, just above the $24.78 billion consensus. But here’s the catch: profit dropped 17 percent year over year. That’s raising questions about pricing pressure and what’s really happening with costs in the core car business.
Gross margin jumped to 20.1 percent, the best it’s been in two years. Automotive margin climbed to 17.9 percent from 15.4 percent the prior quarter, a 2.5 percentage point gain that suggests the economics at the vehicle level are improving. Trailing twelve month EPS came in at $1.08. What you won’t find in most summaries? Vehicle delivery totals or detailed free cash flow numbers. So if you’re serious about understanding the quarter, you’ll need to dig into the official 10-Q for production counts, segment revenues, and actual cash flow statements.
Management announced plans to push capital expenditures past $20 billion in 2026. The money’s earmarked for AI infrastructure, humanoid robotics, and semiconductor development. That level of CapEx is going to pressure near term free cash flow, but it shows where Tesla’s headed: Optimus production and autonomous vehicle services. Despite the earnings beat, shares fell 3.33 percent to $416.56 the session after the release. The market clearly focused more on execution risks and capital intensity than on margin gains.
Core financial metrics summary:
- Revenue: $24.9 billion (Q4 2025), up 0.48 percent versus estimates
- EPS: $0.50 (beat by $0.05); TTM EPS $1.08
- Net income: down 17 percent year over year (Q4 2025)
- Gross margin: 20.1 percent; automotive margin 17.9 percent
- Vehicle deliveries: not disclosed in available summaries; check SEC filings
- Free cash flow and CapEx: 2026 CapEx planned above $20 billion; detailed FCF not provided in source material
Revenue Breakdown by Business Segment
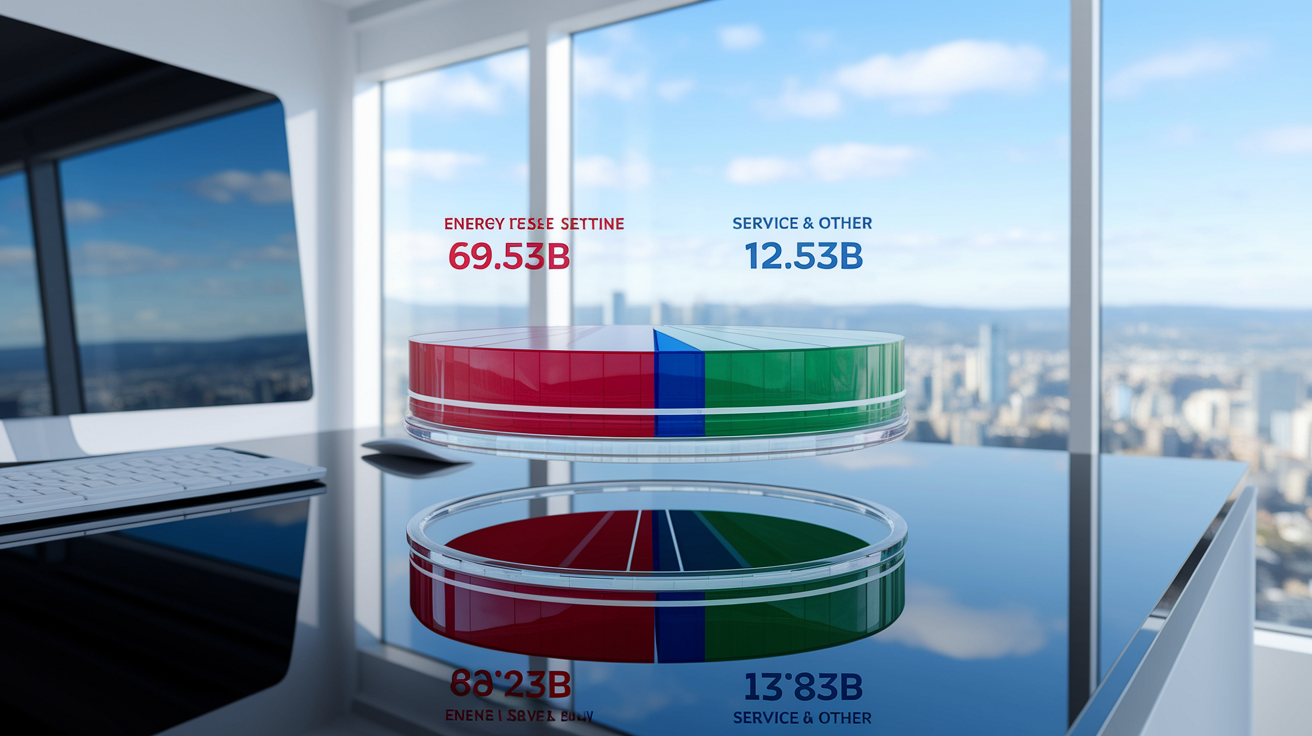
Tesla’s revenue mix kept shifting through fiscal 2025. Automotive revenue fell to $69.53 billion, down 9.79 percent from $77.07 billion in FY2024. That’s a $7.54 billion drop. The automotive segment now makes up 73.32 percent of total revenue, down from 78.89 percent the year before and 85.17 percent in FY2023. The decline probably reflects some combination of lower vehicle volumes, pricing moves to stay competitive, and maybe a shift toward lower priced models, though we don’t have precise delivery counts or average selling prices from the summarized data.
Energy Generation & Storage revenue grew 26.62 percent year over year to $12.77 billion in FY2025, up from $10.09 billion in FY2024. The segment’s share of total revenue climbed to 13.47 percent, nearly double the 6.24 percent it captured in FY2023. Services & Other revenue rose 18.95 percent to $12.53 billion, grabbing 13.21 percent of the total. Put together, energy and services now account for more than a quarter of Tesla’s revenue. That’s a real diversification of the business model, reducing how much the company leans on vehicle sales alone. Quarter over quarter trends within FY2025 weren’t detailed in the source material, so you’ll want to review quarterly segment disclosures in the 10-Q to see momentum and seasonal patterns.
| Segment | Revenue (FY2025) | YoY Change | Share of Total |
|---|---|---|---|
| Automotive | $69.53 billion | -9.79% | 73.32% |
| Energy Generation & Storage | $12.77 billion | +26.62% | 13.47% |
| Services & Other | $12.53 billion | +18.95% | 13.21% |
| Total Revenue | $94.83 billion | -2.94% | 100% |
Margin and Profitability Analysis

Tesla’s margin performance in the most recent quarter showed real improvement even though the top line faced headwinds. Gross margin reached 20.1 percent in Q4 2025, the highest it’s been in two years, up from sub-19 percent levels in several prior quarters. That expansion points to better cost control, favorable mix shifts in the automotive portfolio, or scale benefits in energy and services. Automotive gross margin specifically climbed to 17.9 percent from 15.4 percent in the previous quarter, a 2.5 percentage point gain. The automotive margin recovery is particularly interesting given the revenue decline in that segment. It indicates Tesla prioritized profitability over volume in its pricing and production decisions.
Operating margin trends weren’t spelled out in the source summaries, so you’ll need to check the income statement in the 10-Q to calculate operating income as a percentage of revenue and figure out how much of the gross margin gain actually flowed through to the operating line. Net income fell 17 percent year over year in Q4 2025, even as gross margin improved. That points to higher operating expenses, elevated R&D spending tied to AI and robotics initiatives, or increased interest and other costs. The gap between margin expansion and profit contraction shows the capital intensity trade off: Tesla’s investing heavily in future platforms while trying to stabilize the economics on current products.
The profit decline also raises questions about one time items or non-GAAP adjustments. The source material didn’t break out GAAP versus non-GAAP net income, stock based compensation, restructuring charges, or tax impacts. You’ll want to reconcile reported EPS of $0.50 with net income attributable to common shareholders and verify whether the 17 percent profit drop is a clean year over year comparison or affected by discrete events. Margin sustainability will depend on whether automotive demand stabilizes, energy and services continue to scale, and whether the high CapEx planned for 2026 starts generating returns in 2027 and beyond.
Vehicle Production and Delivery Metrics
Vehicle production and delivery data were notably missing from the widely circulated earnings summaries. That’s a critical gap if you’re trying to assess Tesla’s volume trajectory. In prior quarters, Tesla reported global deliveries broken out by Model 3/Y and Model S/X, along with production totals per line. The lack of delivery numbers in this release makes it tough to separate price effects from volume effects in the automotive revenue decline. If deliveries fell less than 9.79 percent year over year, the revenue drop would be driven partly by lower average selling prices. If deliveries fell more, volume weakness is the bigger driver.
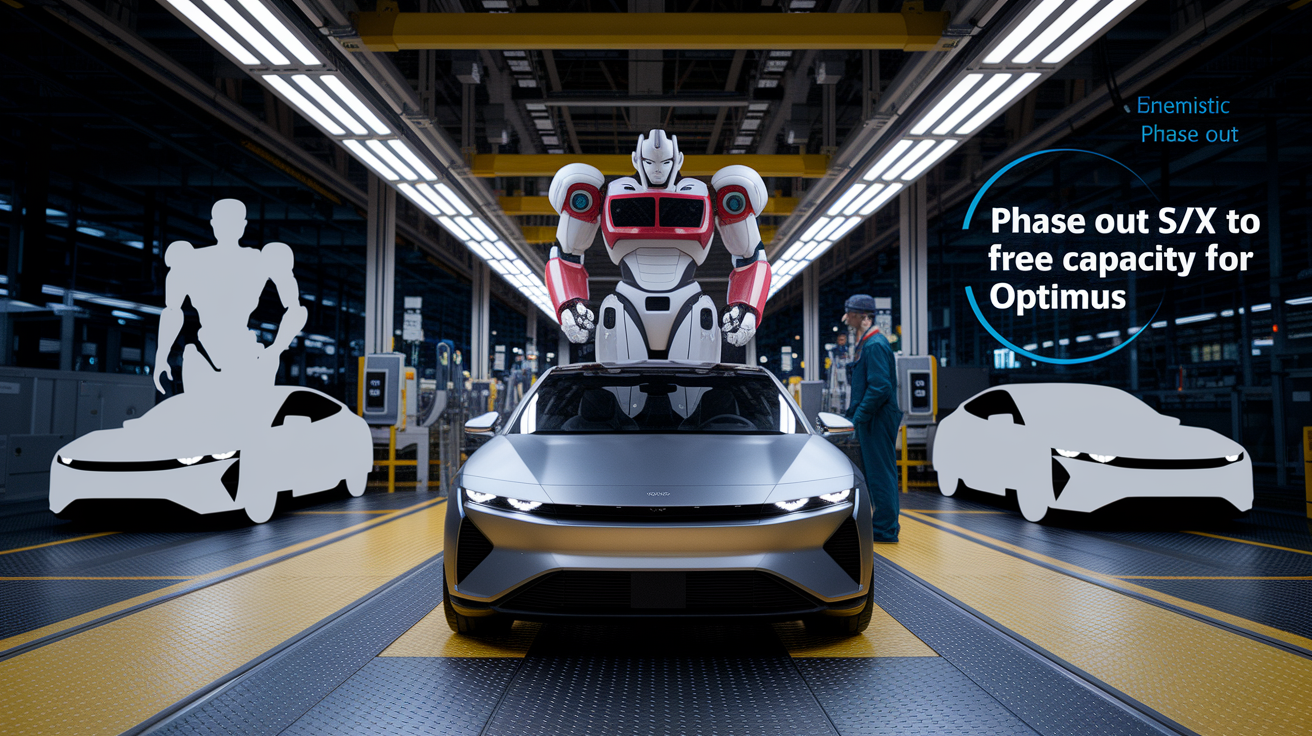
Management announced it will phase out certain Model S and Model X trims to free manufacturing capacity for Optimus humanoid robot production. That strategic shift signals a prioritization of robotics over legacy premium sedans and SUVs, which have represented a small and declining share of total deliveries in recent years. The move also suggests Model S/X volumes will continue to shrink, concentrating automotive revenue on the higher volume Model 3 and Model Y platforms. You should watch for updated delivery guidance by model line in the next quarterly report and track whether Cybertruck ramps contribute incremental volume or cannibalize existing models.
Estimated delivery performance (based on revenue and margin clues; exact figures not provided):
- Model 3/Y: majority of total deliveries; no specific count disclosed
- Model S/X: phasing out select trims for Optimus production capacity
- Cybertruck: spotted at factory; ramp status and delivery count not stated
- Total global deliveries: not disclosed in source material; consult 10-Q for official numbers
Cash Flow and Balance Sheet Overview
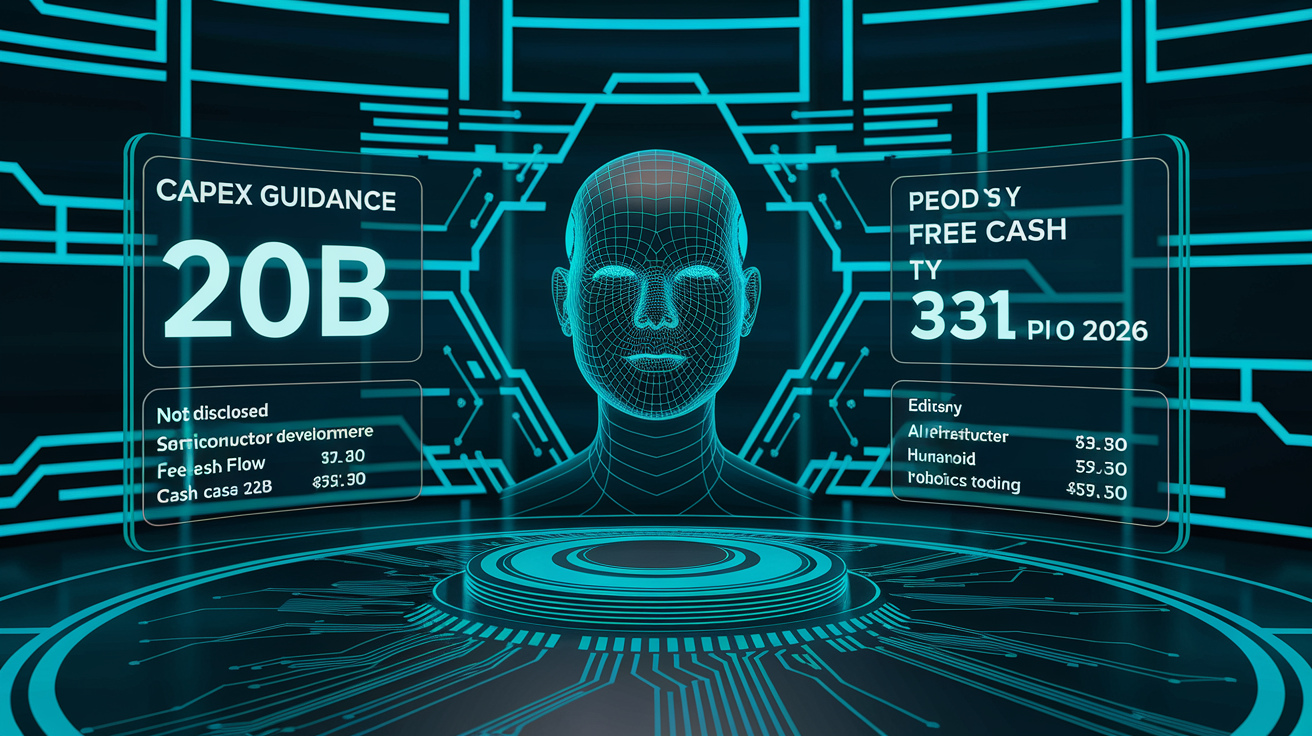
Free cash flow and balance sheet metrics were largely missing from the summarized earnings content. That means you’ll need to turn to the official cash flow statement in the 10-Q for a complete picture. Operating cash flow, capital expenditures, and ending cash balances weren’t provided in the scraped summaries. What is clear? Management plans to spend more than $20 billion in capital expenditures during 2026. That’s a significant step up from prior years and a level that will pressure free cash flow unless operating cash flow rises right along with it.
The elevated CapEx is earmarked for AI infrastructure, semiconductor production, and humanoid robotics tooling to support the Optimus program. That investment cycle mirrors Tesla’s historical pattern of heavy upfront spending ahead of new product ramps, but the scale is larger and the return timeline more uncertain than traditional vehicle programs. If operating cash flow stays flat or declines because of automotive revenue pressure, 2026 free cash flow could turn negative or compress sharply. You should monitor quarterly cash flow statements to assess whether Tesla taps debt markets, equity issuance, or draws down cash reserves to fund the CapEx plan.
| Metric | Value | YoY Movement |
|---|---|---|
| Free Cash Flow | Not disclosed | Not disclosed |
| Cash on Hand | Not disclosed | Not disclosed |
| CapEx (2026 guidance) | > $20 billion | Material increase |
Market Reaction and Stock Performance
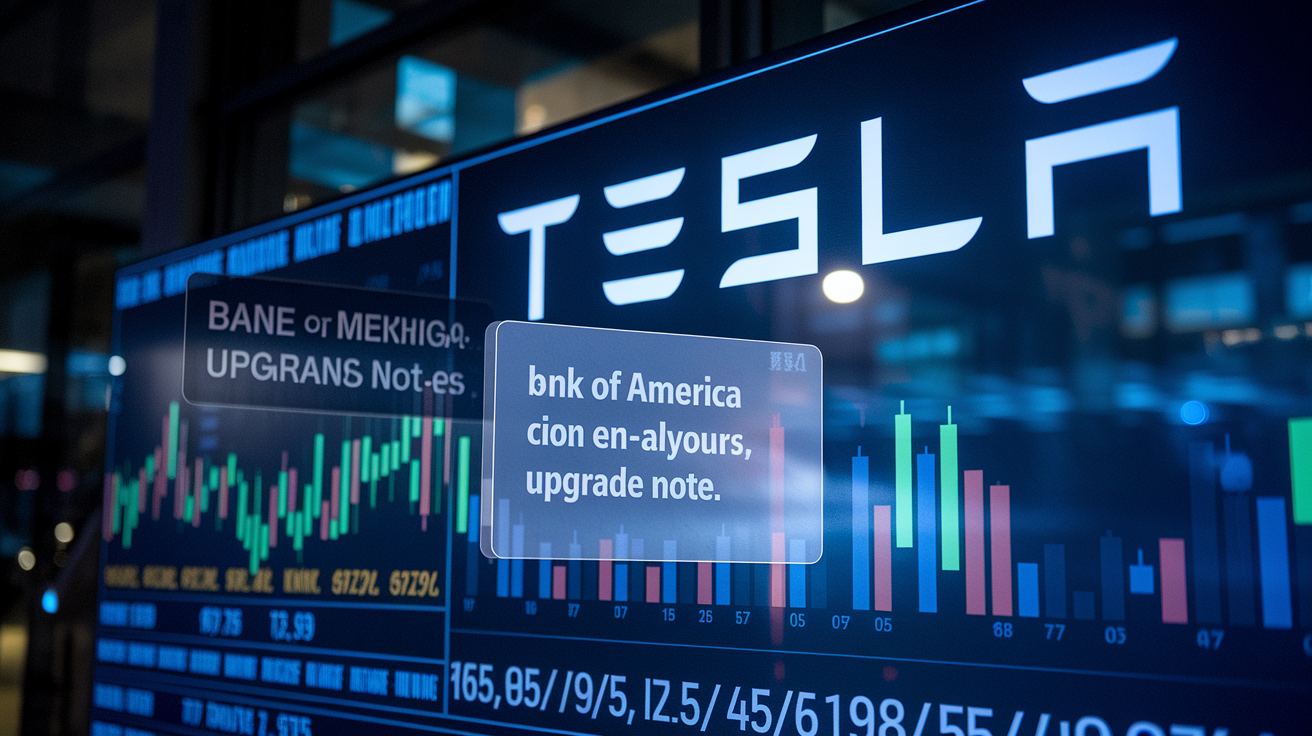
Tesla shares fell 3.33 percent to $416.56 following the Q4 2025 earnings release, despite an 11.11 percent EPS beat and a modest revenue surprise. The negative reaction suggests investors focused on the 17 percent year over year profit decline, the automotive revenue contraction, and the capital intensity implications of the $20 billion CapEx plan rather than the margin improvement. After hours volatility often reflects algorithmic trading and headline parsing. The multi day price trend will reveal whether institutional investors view the quarter as a cyclical trough or the start of a longer profitability headwind.
Analyst sentiment appeared mixed in the immediate aftermath. Bank of America published a revaluation note on March 4, 2026, incorporating future robotaxi profit assumptions and lifting its price target. That helped shares recover some ground. The optimism reflects the view that Tesla’s pivot to autonomous services and humanoid robotics could unlock revenue streams with higher margins than traditional auto sales. Other analysts may have grown more cautious on near term earnings given the automotive revenue decline and the cash flow impact of elevated CapEx, creating a split between growth focused and value focused investment cases.
Forward-Looking Guidance and Strategic Outlook

Management’s 2026 outlook centers on a strategic pivot toward artificial intelligence, autonomous driving, and humanoid robotics rather than aggressive vehicle volume expansion. The company set a target to produce 1 million Optimus robots annually, signaling confidence in manufacturing scale and market demand for commercial and industrial humanoid platforms. Executives emphasized that “the future is autonomous,” framing the robotaxi business and Full Self-Driving expansion into Europe as multi year growth drivers that justify the $20 billion CapEx commitment. No specific revenue or delivery guidance for 2026 was provided in the summarized materials, leaving analysts to model scenarios based on historical trends and management commentary.
Production forecasts for existing vehicle lines weren’t detailed, but the phase out of Model S/X trims implies flat to declining volume in the premium segment. Model 3/Y production will likely remain the core volume driver, with Cybertruck ramp contributing incremental units if supply chain constraints ease. Margin expectations hinge on whether automotive gross margin holds near the 17.9 percent level achieved in Q4 2025 or compresses if pricing competition intensifies. Energy and services segments are expected to continue double digit growth, helping offset automotive volatility, but segment level margin and profitability disclosures remain sparse.
Expansion plans include FSD rollout in Europe, Cybercab sightings at factories indicating near term production trials, and semiconductor infrastructure buildout to support in house AI chip development. Each initiative carries execution risk. Regulatory approval timelines for FSD in Europe are uncertain, Cybercab commercial launch depends on autonomous vehicle regulations, and humanoid robot demand is unproven at scale. Management acknowledged supply chain constraints, geopolitical risks, and intense competition from Chinese robotics firms as headwinds, but provided no quantitative risk mitigation or contingency plans. You should track quarterly updates on Optimus production milestones, FSD regulatory approvals, and CapEx efficiency to gauge whether the strategic pivot is on track or facing delays.
Final Words
We ran through Tesla’s quarterly scorecard: revenue, EPS, margins, business-segment performance, deliveries, cash flow and the stock reaction. The post broke each area into a quick numbers snapshot, a segment revenue map, margin analysis, production and delivery details, balance-sheet notes, market moves, and forward guidance.
Why it matters: margins and deliveries drive profits, free cash flow supports growth, and guidance sets near-term expectations. Watch deliveries, margin trends, free cash flow and upcoming guidance calls.
This tesla earnings report breakdown should help you put the quarter in portfolio context and stay focused on the plan.
FAQ
Q: What is the breakdown of Tesla income?
A: The breakdown of Tesla income is split mainly among automotive sales, energy generation & storage, and services/other; automotive makes up the largest share, energy is growing, and services add smaller, often higher-margin revenue.
Q: How much would $10,000 invested in Tesla 10 years ago be worth today?
A: A $10,000 investment in Tesla 10 years ago would be worth a multiple of the original depending on your split-adjusted entry price; calculate shares bought then times today’s price, accounting for stock splits and no dividends.
Q: What to expect from a Tesla earnings report?
A: From a Tesla earnings report, expect revenue, EPS, vehicle deliveries, gross and operating margins, guidance on production and margins, free cash flow, and management commentary on supply, pricing, and demand trends.
Q: What does Jim Cramer say about Tesla?
A: What Jim Cramer says about Tesla is that he often toggles between bullish views on long-term potential and caution about valuation and execution; check his latest remarks for the current stance and key arguments.