
What if global trade is not just a growth engine but the economy’s weather vane, telling us when storms are coming?
Trade flows connect output, jobs, prices and capital across borders, so a tariff, a port delay or a drop in foreign demand can ripple through growth and market stability.
This piece argues trade is two-edged: it boosts living standards by widening markets and cutting input costs, yet it also amplifies shocks and shifts jobs.
Investors should watch export intensity, import-price pass through, supply chain fragility and policy moves next.
Core Economic Effects of Global Trade on Modern Economies

Global trade shapes national income through direct links to GDP components. In the standard accounting identity, GDP equals consumption plus investment plus government spending plus net exports (exports minus imports). Imports appear as a negative term, but that doesn’t mean they harm the economy. They supply inputs that boost productivity and consumer choice. Exports represent production sold abroad, directly creating output and employment. The United States has run a trade deficit every year since 1975, yet the correlation between net exports as a share of GDP and GDP growth over that half century is about –0.6 percent. No systematic relationship there.
Rising global trade shares matter because they tie domestic economies more tightly to foreign demand, supply disruptions, and price swings. World trade as a share of world GDP climbed from 26 percent in 1970 to 63 percent in 2022. Export intensity varies widely: Germany exports roughly 45 to 47 percent of GDP, China about 18 to 20 percent, and the United States around 11 to 12 percent. Higher export shares amplify sensitivity to global shocks. A drop in foreign demand hits export heavy economies harder and faster.
Five measurable channels link trade to economic outcomes:
Export driven output: Foreign sales translate directly into domestic production and jobs in export sectors.
Import driven productivity: Access to cheaper or better foreign inputs and capital goods raises efficiency and output per worker.
Capital flows and investment: Trade deficits financed by capital inflows can fund long term infrastructure and productive capacity if directed well.
Price and inflation pass through: Tariffs and freight costs alter import prices, feeding into consumer inflation and real wages.
Employment redistribution: Trade shifts jobs from import competing industries toward export sectors and services, often unevenly across regions and skill levels.
Trade deficits alone don’t signal economic weakness. In 2024, the United States ran a goods trade deficit of $1,213 billion and a services trade surplus of $295 billion. The aggregate balance nets out imbalances across categories, and the negative correlation with GDP growth suggests other factors drive both trade and growth more powerfully than trade drives growth by itself. Savings rates, fiscal policy, investment appetite.
Global Trade Structures and Measurements That Shape Economic Interpretation

Gross trade statistics count the full value of goods crossing borders, but global value chains split production across many countries, so origin assignments can mislead. An iPhone assembled in China and shipped to the United States is recorded as a Chinese import at full retail value, even though design, software, and many components originate elsewhere. In 2004, switching from gross to value added measurement reduced the recorded U.S. bilateral deficit with China by about 40 percent and increased the U.S. bilateral deficit with Japan by about 40 percent. Japan supplied intermediate inputs to Chinese assembly plants.
Services trade often escapes attention in tariff debates, yet it matters for aggregate balances and competitiveness. The U.S. services surplus of $295 billion in 2024 offsets part of the goods deficit. Tariff calculations that ignore services misstate net trade exposure and can produce policy aimed at the wrong target.
| Measure Type | What It Captures | Impact on Economic Interpretation |
|---|---|---|
| Gross trade | Full value of goods at border; includes all inputs and assembly | Overstates bilateral imbalances when supply chains cross borders; useful for customs and logistics |
| Value added trade | Income captured by each country in the production chain | Reveals where profits and wages accrue; adjusts deficits to reflect true origin of production |
| Services balance | Cross border sales of software, finance, tourism, transport, design | Offsets goods deficits in many advanced economies; critical for aggregate net export calculations |
Trade Policy, Tariffs, and Their Direct Economic Outcomes
U.S. tariff measures against Chinese products introduced in 2018 and 2019 covered roughly $360 billion of imports; China’s retaliatory tariffs covered about $110 billion. Those measures raised prices for importers and consumers by billions of dollars per month during peak enforcement. In early 2025, a rolling tariff reset began in February and accelerated after “Liberation Day” announcements on April 2, 2025, with further changes through May and September. By September 11, 2025, tariff levels had reached the highest rates since the 1930s.
Economic transmission runs through multiple channels. Higher import prices increase costs for households and firms using imported goods or inputs. That reduces real incomes and purchasing power. Lower domestic demand and higher production costs cut returns to capital and slow investment. Retaliatory tariffs from trading partners weaken foreign demand for U.S. exports, compounding the output loss.
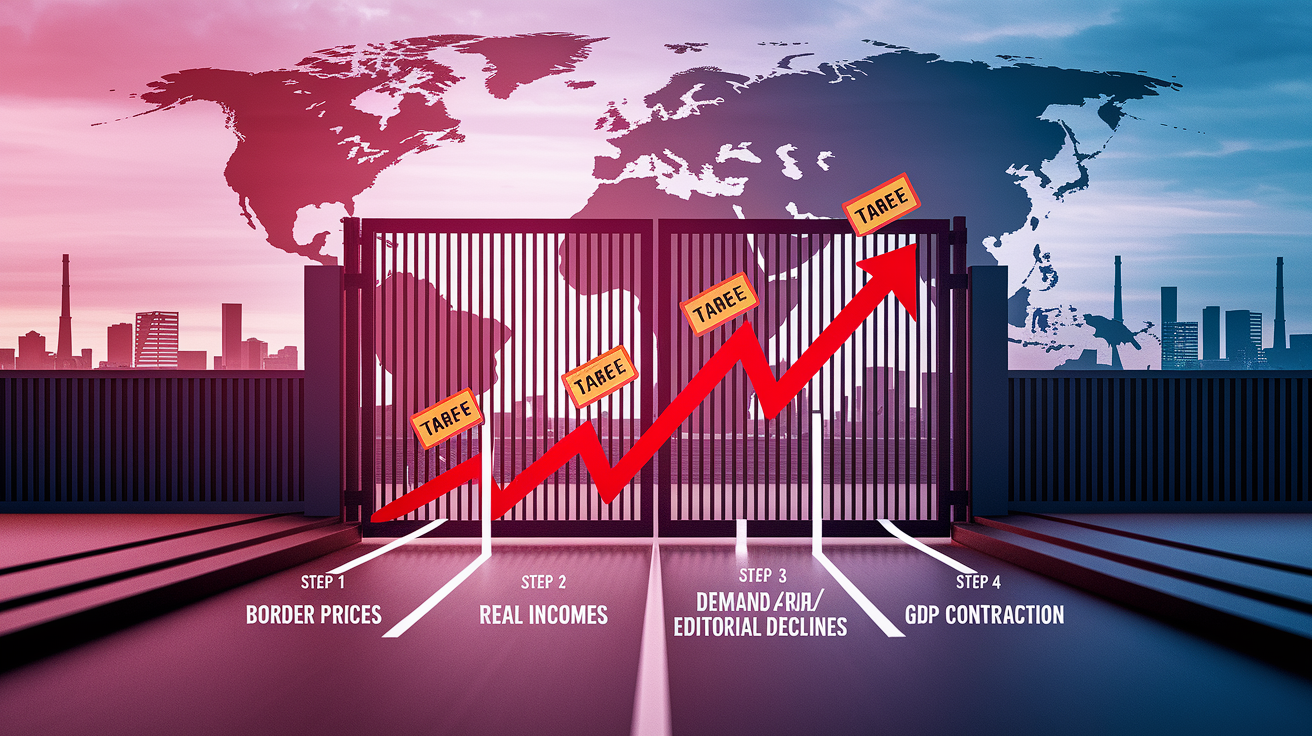
The modeled macro pathway from tariff introduction to GDP and employment effects follows four steps:
First, tariffs raise import prices at the border.
Second, higher costs reduce real household income and firm profitability.
Third, lower income and weaker foreign demand shrink consumption, investment, and exports.
Fourth, output and employment contract, especially in trade exposed and capital intensive sectors.
Sector impacts cluster in durable goods manufacturing, agriculture, and mining. The G Cubed global economic model projects that tariffs in effect as of September 2025 reduce U.S. GDP growth by 0.23 percentage point in 2025 and 0.62 percentage point in 2026, while consumer price index inflation rises by 1.0 percentage point for the year beginning September 11, 2025. The inflation spike is temporary, but the U.S. price level remains permanently higher than the no tariff baseline. Employment measured as hours worked shifts structurally away from manufacturing and resource extraction toward services, with lower real wages across all workers in the long run.
Global Supply Chains, Disruptions, and Macroeconomic Vulnerability

Global value chains account for roughly half of world trade flows, with intermediate goods crossing borders multiple times before final assembly. That structure spreads efficiency gains but also transmits shocks rapidly. A bottleneck in one country halts production downstream in many others.
Major supply chain shocks in recent years include:
Container freight spikes: Spot rates on key Asia to North America lanes surged from a few thousand dollars per 40 foot box to peaks near $15,000 to $20,000 per FEU in 2021 and 2022, raising import costs and feeding inflation.
Semiconductor shortages: Limited chip supply in 2020 to 2022 cut global auto production by millions of vehicles, idling assembly plants and displacing workers.
2020 services collapse: Cross border services trade fell roughly 20 percent during the COVID shock, hitting tourism, transport, and professional services hard.
Auto output losses: Single product bottlenecks in semiconductors show how concentrated inputs magnify disruption effects.
GVC share data: With half of trade flows in intermediate goods, any border delay or input shortage cascades across the chain.
These disruptions raised inflation by increasing import prices and limiting supply. Firms responded by near shoring some production, diversifying suppliers, and holding larger inventories of critical inputs. Reshoring investment accelerated after 2020, but globalization hasn’t reversed. Companies are layering regional redundancy on top of global networks rather than abandoning them.
Distributional and Labor Market Impacts of Global Trade

Manufacturing employment as a share of total employment has declined across advanced economies over the past two decades, regardless of whether countries ran trade deficits or surpluses. Germany provides a clear case: it maintained persistent trade surpluses of about 4 to 5 percent of GDP over the past three decades while production industry employment fell by over one third. Automation is a major driver. Factories produce more output with fewer workers, and that trend holds across trade regimes.
Rapid and massive increases in trade with China between 1999 and 2011 harmed specific U.S. local economies. Effects were strongest where industries were already in decline, wages were relatively high, or education levels were low. Employment and wage losses persisted for years in these regions because workers faced difficulty switching to new industries and geographic mobility remained limited. Safety nets and retraining programs can shorten unemployment spells and improve reemployment outcomes, but adjustment is slow without active policy support.
Trade raises aggregate income but redistributes within countries. Manufacturing and routine occupations face outsized displacement risk. Services, technology, and skilled professions often gain from expanded export markets and access to cheaper inputs. Inequality rises when gains concentrate among mobile capital and high skill labor while low skill workers in import competing sectors lose jobs and bargaining power. Policy responses are justified on the same grounds as assistance for technology driven job losses. Wage insurance, retraining, regional subsidies.
Global Trade, Capital Flows, and Macroeconomic Balances

A persistent national trade deficit means a country spends more than it earns and finances the gap by borrowing from abroad. Those capital inflows can support long term productive investment if directed toward infrastructure, education, or technology. The 1981 to 1985 U.S. expansion illustrates the mechanism: tax cuts and defense spending raised GDP, consumption, and imports; higher interest rates attracted capital inflows, strengthened the dollar, and widened the goods trade deficit. The trade balance responded more to fiscal and monetary policy than to trade restrictions.
Trade balances are driven strongly by national savings and investment decisions. Legislation enacted in July 2025 is projected to increase the federal budget deficit, reduce national savings, and if financed by capital inflows, worsen the U.S. trade deficit. An effect larger than tariff only impacts. Exchange rate movements mediate trade shocks: a stronger currency makes imports cheaper and exports more expensive, widening the trade deficit; a weaker currency does the opposite.
Three forces move currency values and trade flows:
Interest rates: Higher domestic rates attract foreign capital, strengthening the currency and widening the trade deficit.
Capital inflows: Portfolio and direct investment inflows bid up the currency, making exports less competitive.
Fiscal stance: Large deficits require financing; if financed abroad, capital inflows appreciate the currency and imports rise.
Case Studies of Major Economies and Trade System Effects
China’s transformation from a closed economy to the world’s largest exporter reshaped global value chains. In 2004, value added adjustments revealed that China’s role was primarily assembly, with much of the production income captured elsewhere. By the late 2010s, China had moved up the value chain, producing more intermediate inputs domestically and exporting higher value goods. U.S. tariffs in 2018 to 2019 covered $360 billion of Chinese imports and triggered $110 billion in retaliatory measures, but the underlying integration of supply chains meant both economies faced higher costs and production disruptions.
The United States has run a trade deficit every year since 1975, yet exports and imports have both more than doubled over that period. The correlation between U.S. exports and imports exceeds 90 percent, meaning they move together. Both fell sharply in the 2008 to 2009 financial crisis and again in 2020. That co movement reflects integrated supply chains and the fact that imports supply inputs for export production. U.S. services exports have grown steadily, generating a $295 billion surplus in 2024 that offsets part of the goods deficit.
The European Union’s single market promotes integrated value chains by eliminating tariffs and reducing non tariff barriers among member states. Intermediate goods cross borders multiple times, raising efficiency but also tying member economies tightly together. ASEAN countries and Germany provide examples of export oriented growth strategies: Germany’s 45 to 47 percent export to GDP ratio and persistent surpluses supported high living standards, though manufacturing employment still fell due to automation. World merchandise trade reached an estimated $28.5 trillion in 2021, illustrating the scale of global integration.
| Region | Key Trade Feature | Economic Impact |
|---|---|---|
| China | Moved from assembly to upstream production; exports ~18 to 20% of GDP | Rapid GDP growth; significant displacement of manufacturing jobs in trade partners; increased innovation and productivity domestically |
| United States | Persistent deficits since 1975; services surplus; exports ~11 to 12% of GDP | High consumption and investment financed by capital inflows; uneven regional impacts; strong services sector growth |
| European Union | Single market; deep value chain integration; varied export intensity across members | Efficiency gains from specialization; vulnerability to intra EU demand shocks; strong export performance for Germany |
| ASEAN | Export oriented manufacturing; regional supply chains; intermediate goods trade | Rapid income convergence; employment growth in manufacturing; exposure to global demand swings |
Future Trends in Global Trade and Economic Impact Forecasts

Digital trade is rising as services, data, and software cross borders more easily than physical goods. Cross border e commerce, cloud computing, and streaming services are growing shares of trade. Data localization rules are expanding in response, requiring firms to store data within national borders and comply with local regulations. That fragments markets and raises compliance costs, slowing the efficiency gains from digital integration.
Near shoring and diversification strategies accelerated after 2020 supply chain stress. Firms are investing in regional production capacity and dual sourcing arrangements for critical inputs. Reshoring investment is rising, especially in semiconductors, logistics, and digital infrastructure, but globalization isn’t reversing. Companies are adding regional redundancy rather than abandoning global networks. Costs remain a binding constraint; labor intensive manufacturing won’t return to high wage countries at scale unless automation closes the gap.
Four key forward looking drivers will shape trade’s economic impact:
Digital services expansion: Software, finance, design, and data flows will grow faster than goods trade, shifting competitive advantage toward human capital and intellectual property.
Resilient supply chains: Investment in redundancy, inventory buffers, and regional capacity will reduce vulnerability but raise costs, affecting inflation and profit margins.
Targeted export controls: Increasing use of trade restrictions on advanced technology (semiconductors, AI enabling gear) since 2018 to 2022 is reshaping investment geography and R&D location decisions.
Regional diversification: Trade agreements and near shoring will strengthen regional blocs (North America, EU, ASEAN) at the expense of pure global efficiency, altering trade flows and growth prospects.
Final Words
We tracked how trade feeds GDP—exports boost output and jobs, imports shape consumption and productivity—then showed how measurement, tariffs, supply‑chain shocks, and labor shifts change the economic picture.
That matters for portfolios: expect sectoral winners and losers, potential inflation from trade costs, and uneven regional labor impacts. Watch yields, trade balances, services data, and value‑added trade metrics.
The global trade impact on economy is complex, not a single signal. Keep diversification, supply‑chain exposure, and policy shifts on your checklist—markets adapt, and a steady process will serve you well.
FAQ
Q: How does global trade impact the economy?
A: The global trade impacts the economy by raising output through exports, lowering consumer prices via imports, shifting jobs across industries, and boosting productivity and investment; long‑run trade share rose from about 26% in 1970 to 63% in 2022.
Q: How will Trump impact the economy?
A: The Trump impact on the economy depends on policy choices; likely effects include changes to trade tariffs, taxes, and regulation that can alter growth, inflation, investment, and which sectors gain or lose.
Q: How is the United States’ economy?
A: The United States’ economy shows persistent trade deficits—2024 goods deficit about $1,213B and services surplus about $295B—moderate export share (~11–12% of GDP); deficits reflect spending above domestic saving, not automatic weakness.