
What if market calm isn’t safety but a temporary pause before the next storm?
Volatility clustering — the tendency for big swings to be followed by big swings and quiet days to follow quiet days — shows up across stocks, bonds, currencies and commodities.
That pattern matters because recent turbulence raises the odds of more turbulence, so yesterday’s chaos should change how you size positions, set stops, and forecast risk.
This post lays out the pattern, the key statistics, and practical rules for using volatility’s memory to manage risk more realistically.
What Is Volatility Clustering? (Quick Definition and Why It Matters)

Volatility clustering is a pattern that shows up in pretty much every financial market you can think of. Big price swings get followed by more big swings. Calm days follow calm days. It’s not random. Markets move through phases where turbulence either compresses into quiet stretches or explodes into wild sessions that feed on themselves. Benoit Mandelbrot spotted this back in 1963, and since then it’s been confirmed across every major asset class and every timeframe you’d care to test.
Why should you care? If you’re managing positions or trying to control risk, volatility clustering tells you something useful about tomorrow based on what happened today. A quiet session suggests more quiet ahead. A chaotic day raises the odds of another chaotic day soon after. That persistence matters when you’re deciding how much to risk, where to set your stops, or how to forecast what could go wrong. Models that assume volatility stays constant? They miss this completely and leave you underestimating risk right when it’s about to bite.
The pattern doesn’t care what you trade. Equity indices from New York to Tokyo, currency pairs, commodity futures, bond markets. They all do it. Whether you’re in the S&P 500 or crude oil, the logic holds. Volatility remembers where it’s been. And understanding that memory gives you better risk control and more realistic expectations about what your returns might look like when things get messy.
Statistical Properties Behind Volatility Clustering

If you look at raw daily returns, the autocorrelation is basically zero. Knowing today’s return doesn’t tell you much about tomorrow’s direction. But square those returns or take absolute values, and suddenly strong autocorrelation appears. That’s the statistical signature of volatility clustering. The size of moves persists even when direction doesn’t.
This connects directly to the fat tails you see in market data. Price changes aren’t normally distributed. Extreme moves happen way more often than a bell curve would predict. Volatility clustering and heavy tails reinforce each other. Clustered volatility creates more extremes during rough patches, and those extremes feed into the next period’s expected variance. You end up with distributions that have thicker tails and sharper peaks than anything a Gaussian model can handle.
Classical finance loves to assume constant variance over time. That’s called homoskedasticity. Volatility clustering breaks that assumption completely. Variance isn’t constant. It changes, and it changes in ways you can predict if you know what happened recently. That time-varying variance is called conditional heteroskedasticity. Ignore it and your models will be wrong, your confidence intervals will be too tight, and you’ll underprice risk exactly when stress shows up.
Historical Evidence and Empirical Observations
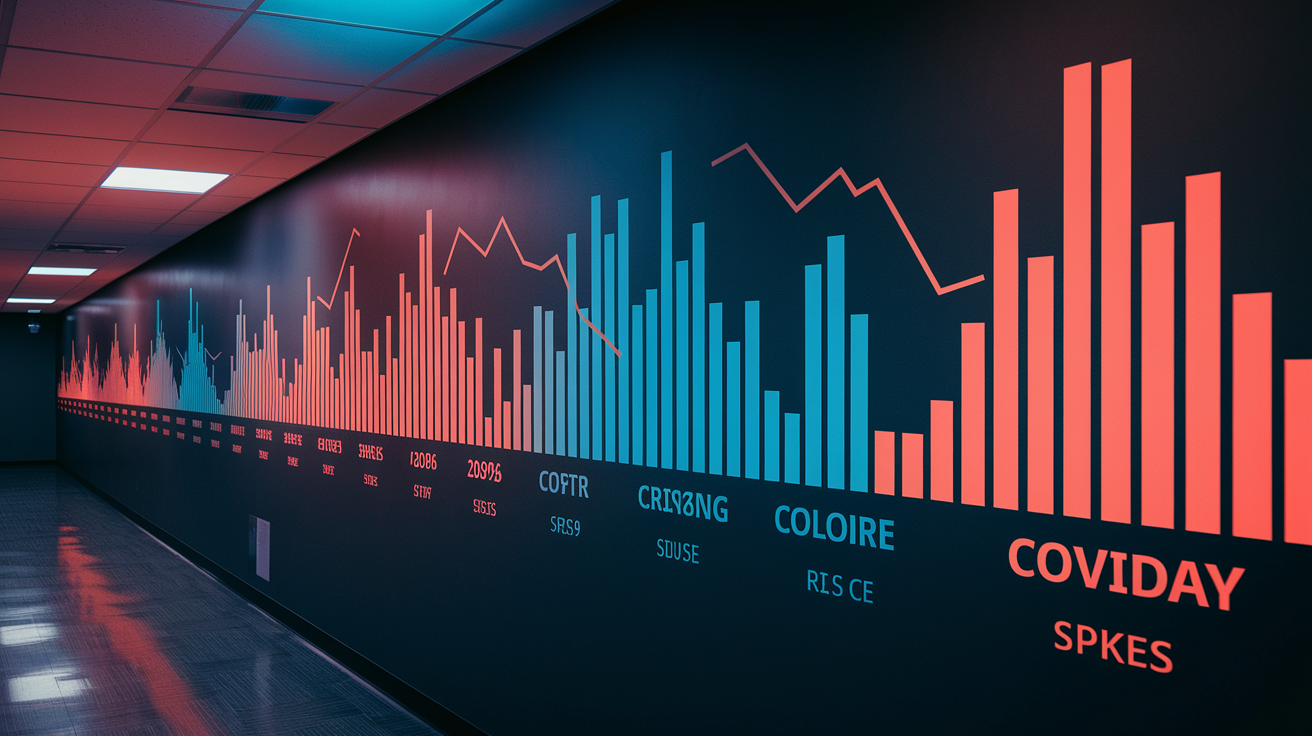
Studies across decades and markets keep finding the same thing. The S&P 500, FTSE 100, Nikkei 225. All of them move through long stretches of calm that get interrupted by bursts of chaos. During the 1990s expansion, daily moves often stayed under 1 percent for months at a time. Then a shock hits and suddenly 2 to 4 percent swings become normal for weeks.
Black Monday in October 1987 is a textbook example. The single day crash got followed by weeks of elevated volatility. Markets didn’t just snap back to calm. Large daily ranges persisted well into 1988. Same pattern during the 2008 financial crisis. From September 2008 through March 2009, volatility stayed extreme for six straight months. Days with moves above 3 percent were common, not outliers.
COVID in March 2020 compressed the timeline but followed the same script. Between March 9 and March 18, the S&P 500 posted huge moves on eight consecutive trading days. Volatility spiked, stayed elevated through April, then gradually declined over the summer. Every episode teaches the same lesson. Volatility regimes stick around, and the transitions between regimes are sharp but not instant.
Modeling Volatility Clustering with ARCH and GARCH
Capturing volatility clustering meant building new tools. Traditional time series methods couldn’t handle the dynamic variance structure showing up in financial returns. That gap led to autoregressive conditional heteroskedasticity models, which treat variance as a moving target driven by recent information.
ARCH Models
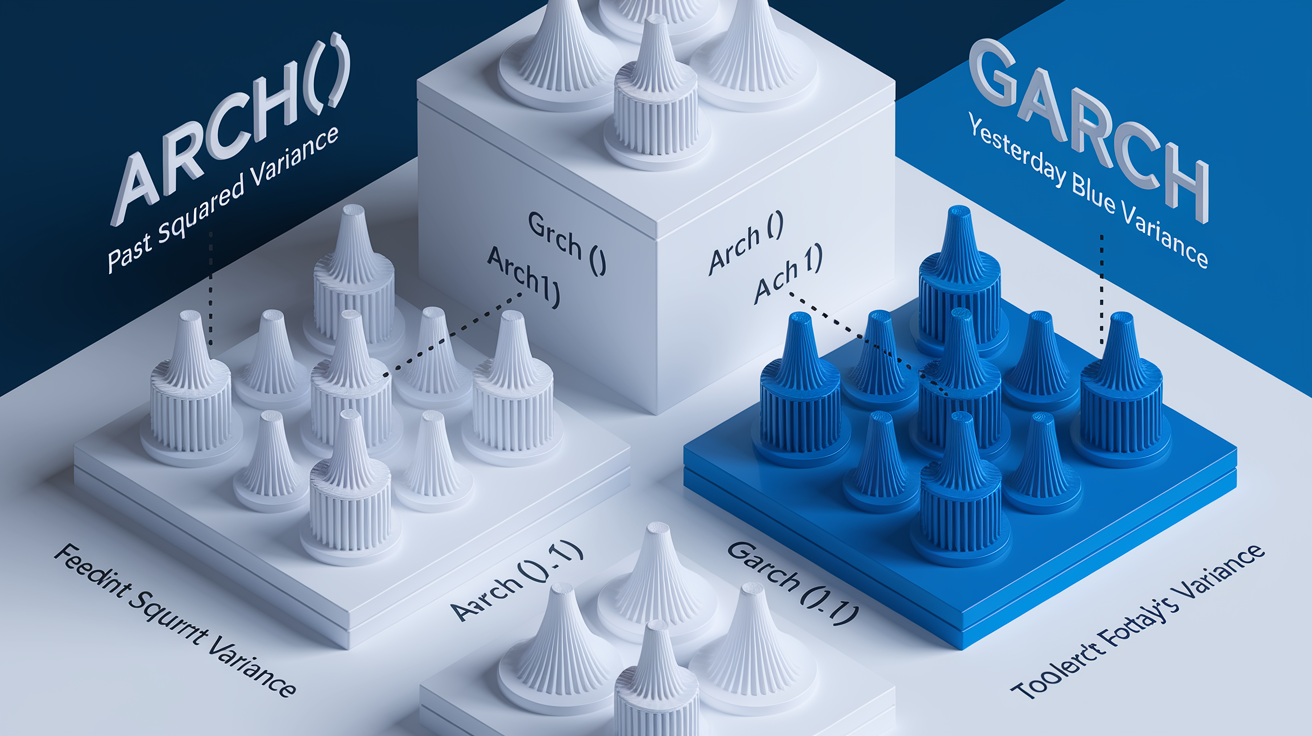
Robert Engle introduced the ARCH model in 1982. The setup is straightforward. Today’s conditional variance depends on past squared forecast errors. In the simplest version, ARCH(1), variance equals a constant plus a coefficient times yesterday’s squared return shock. If yesterday’s return was large, today’s expected variance rises. That direct link between past shocks and current variance captures the clustering effect.
ARCH models worked well for applications from inflation forecasting to equity volatility. But there’s a catch. Capturing long memory in volatility often requires many lagged squared terms, which makes the model clunky and estimation less stable. That limitation pushed researchers toward the next step.
GARCH Models
Tim Bollerslev extended ARCH in 1986 by adding lagged conditional variances into the equation. Instead of relying only on past squared shocks, GARCH includes yesterday’s variance forecast as a predictor of today’s variance. This creates a cleaner representation. A GARCH(1,1) model with just three parameters often beats high order ARCH specifications.
GARCH(1,1) became the industry standard. It balances simplicity with realism. In practice, estimated coefficients on lagged squared shocks and lagged variances often sum close to one, which signals high persistence. That near unit sum means volatility shocks decay slowly. A spike today casts a long shadow over future forecasts, and that aligns with what actually happens during stress periods.
Practical Implications for Portfolio Management and Risk Control

Volatility clustering changes how you manage risk. If variance were constant, one estimate would work for all periods. But clustering means variance is always moving. Risk managers have to forecast it, update it, and adjust exposures on the fly. Ignore the time varying nature of volatility and you’ll end up with poorly calibrated hedges, wrong position sizes, and drawdowns you didn’t see coming.
Value at Risk models rely on volatility forecasts to set capital reserves and position limits. During calm periods, static volatility estimates understate risk when turbulence arrives. During turbulent periods, they overstate risk after volatility starts fading. GARCH based forecasts adapt in real time, which improves the accuracy of risk measures and reduces the frequency of breaches. Expected Shortfall calculations benefit from the same dynamic adjustment, producing more realistic tail risk estimates.
Clustering also shapes portfolio construction and rebalancing rules. You can respond in several ways. Volatility targeting maintains constant risk by scaling exposure inversely to forecasted volatility. Dynamic position sizing reduces allocations when conditional variance rises and increases them when variance falls. Leverage adjustments respond to regime changes, lowering leverage during high volatility clusters to avoid forced deleveraging. Stress testing incorporates periodic volatility spikes to ensure capital adequacy across regimes. Portfolio rebalancing frequency adapts to volatility, with more active adjustment during turbulent periods to control drift.
Key Academic Contributions to Volatility Clustering

The intellectual foundation started with Benoit Mandelbrot’s 1963 observation that price changes in commodity markets showed “long tailed” distributions and clustered variation. Mandelbrot noted that “large changes tend to be followed by large changes, of either sign, and small changes tend to be followed by small changes.” That insight came before formal modeling tools existed, but it framed the question for decades of research that followed.
Robert Engle formalized the pattern in 1982 when he introduced the ARCH model. Engle showed that inflation volatility could be modeled as an autoregressive process in the conditional variance, with past squared forecast errors predicting future variance. The work earned him the 2003 Nobel Prize in Economics and established conditional heteroskedasticity as a core concept in econometrics and finance.
Tim Bollerslev extended ARCH in 1986 by introducing the GARCH specification, which added lagged conditional variances to the model. That extension dramatically improved parsimony and forecasting performance. GARCH(1,1) became the standard model for volatility forecasting in both academia and industry. Mandelbrot’s observation, Engle’s formalization, and Bollerslev’s refinement together created the toolkit used today to measure, model, and manage time varying risk in financial markets.
Final Words
We started by defining volatility clustering—big moves tend to follow big moves—and laid out the stats behind it, like autocorrelation in squared returns and fat tails.
Then we walked through historical examples, showed how ARCH and GARCH capture the pattern, and tied it to portfolio tools such as VaR, position sizing, and stress tests.
Watch the persistence of volatility, event-driven spikes, and model signals.
Volatility clustering in financial markets is manageable; with simple rules (volatility targeting, dynamic sizing) you can keep portfolios steadier and more resilient.
FAQ
Q: What is volatility clustering in finance and what does it look like?
A: Volatility clustering in finance is the tendency for big price moves to follow big moves and small moves to follow small ones, creating persistent high- or low-volatility stretches that affect risk and sizing.
Q: What does Warren Buffett say about volatility?
A: Warren Buffett says volatility is not the same as risk; price swings aren’t the same as the risk of permanent loss, and he views volatility as an opportunity to buy quality at lower prices.