
Think the global economy is back on track?
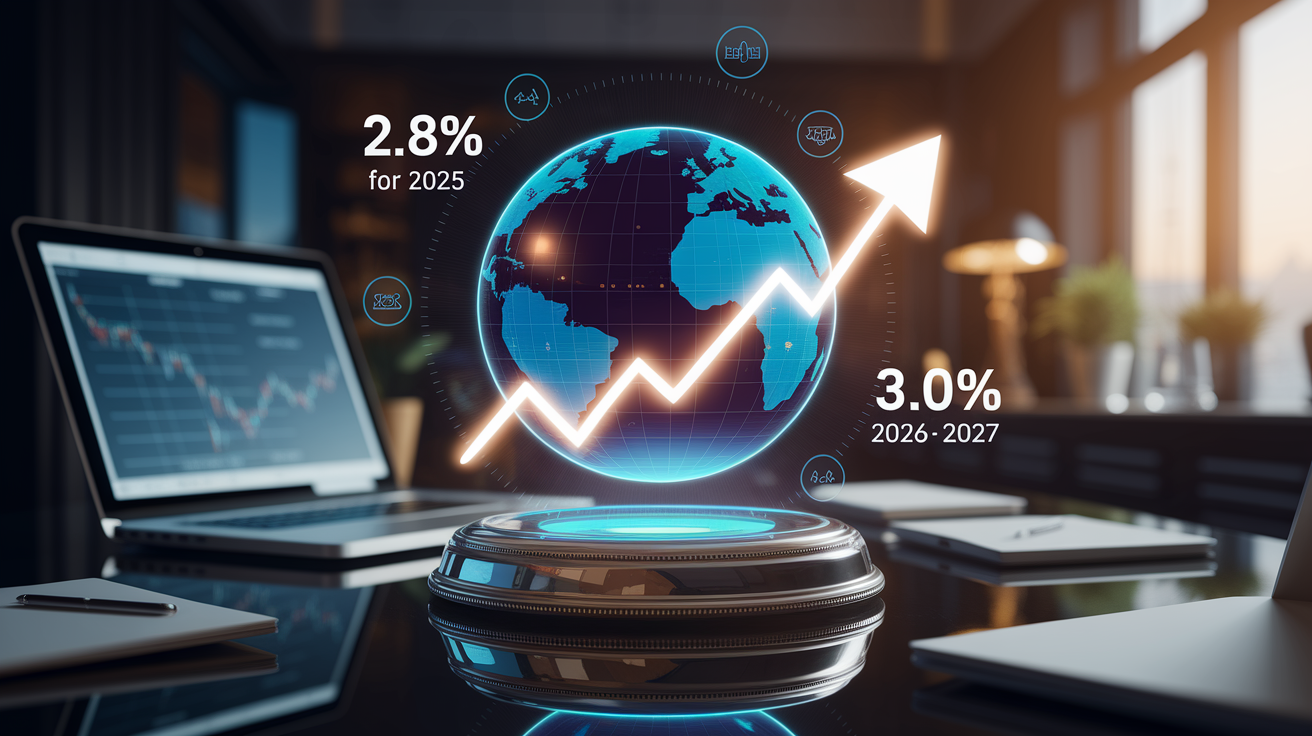
The IMF just cut its 2025 growth forecast to 2.8 percent and flagged a slower, riskier path into 2026-27.
That matters: slower growth plus sticky services inflation keeps central banks cautious, so rates may stay higher longer and borrowing costs remain elevated.
For portfolios, that tends to favor companies with steady cash flow and shorter-duration bonds over long-duration growth names.
Bottom line: use the IMF baseline as a scenario map and watch rate sensitivity, commodity risk, and trade shocks next.
Key Findings From the Latest Global Economic Outlook
The International Monetary Fund dropped its latest World Economic Outlook update on October 14, 2025. It’s a deep dive into global GDP growth, inflation trends, and the macro risks we’re facing through 2027. What follows are the headline numbers that anchor the IMF’s baseline, the core projections shaping how we think about recovery and the policy mess ahead.
Global GDP growth is expected to hit 2.8 percent in 2025, then climb to 3.0 percent in 2026 before settling near that level in 2027. Headline inflation worldwide should cool over the same stretch, though the exact pace reflects ongoing disinflation pressures bumping up against sticky service prices and wage dynamics. These forecasts run through 2027 and bake in data through early October 2025, including the fallout from tariff shocks, tighter financial conditions, and uneven regional recoveries.
Compared to the IMF’s last release, 2025 global growth got chopped by 0.5 percentage points, with smaller cuts to 2026. Revisions varied by region. Advanced economies saw modest downgrades, emerging markets showed mixed changes depending on commodity exposure and policy stances. You can grab all the forecast tables, datasets in CSV and Excel, interactive charts, and the full report PDF from the IMF’s data portal. Methodology notes are there too, explaining how they measure things and handle forecast uncertainty.
Global GDP and Inflation Trends Shaping the World Outlook

A bunch of competing forces are tugging global growth and inflation in different directions. Commodity prices, especially energy and food, have amplified inflation swings. Supply chain normalization has gradually eased goods price pressures. But tight labor markets in many advanced economies have kept wage growth humming, feeding persistent services inflation even as central banks try to cool demand. Monetary tightening is slowing aggregate demand, yet lag effects mean inflation expectations remain elevated in key spots, complicating the path back to central bank targets.
Growth forecasts reflect how these inflation dynamics interact with credit conditions and fiscal policy. Higher policy rates have pushed up borrowing costs for firms and households, slowing investment and consumption. Fiscal consolidation in several large economies is pulling back demand support just as the private sector deleverages. Geopolitical tensions and trade policy uncertainty are discouraging cross border investment and fragmenting supply chains, creating inefficiencies that drag on potential output. The IMF’s baseline assumes a gradual easing of these headwinds. But the pace of disinflation and when central banks start loosening are critical variables.
Five core drivers shape the inflation outlook and influence how central banks react:
- Energy price shocks tied to geopolitical events and production calls by major exporters
- Food price inflation driven by weather shocks, fertilizer costs, and export restrictions
- Supply chain recovery effects as logistics normalize and inventory imbalances unwind
- Demand cooling from monetary tightening and weaker consumer sentiment
- Wage dynamics reflecting tight labor markets and workers’ efforts to protect real incomes
Regional Economic Outlook Across Advanced and Emerging Markets
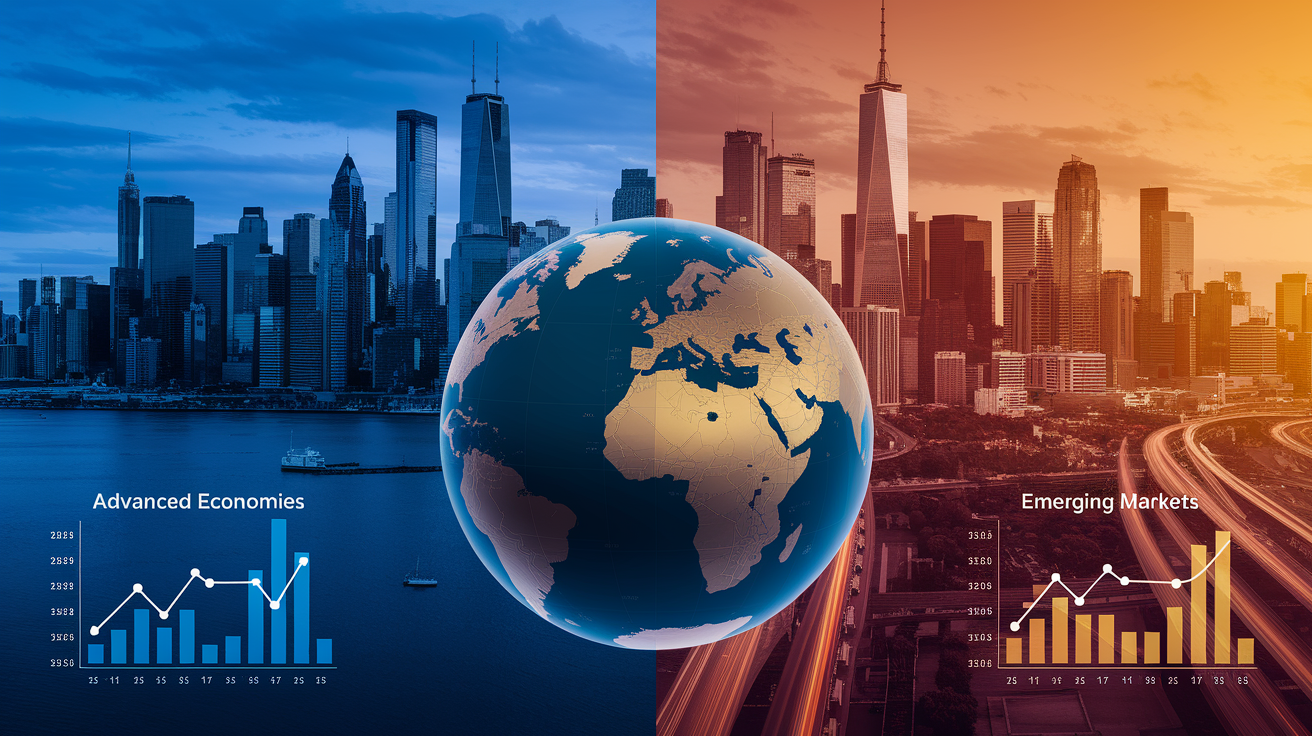
Regional growth and inflation patterns diverge sharply. Differences in policy space, external vulnerabilities, and exposure to trade shocks drive the variation. The IMF’s regional summaries break the global forecast into meaningful blocs, showing where resilience is concentrated and where risks are most acute.
Advanced Economies
Advanced economies face below trend growth as monetary tightening works through the system. The euro area is projected to expand by just 0.8 percent in 2025, accelerating modestly to 1.2 percent in 2026 as real incomes recover and export demand stabilizes. “The euro area’s recovery depends heavily on external demand picking up and households rebuilding savings cushions after two years of real wage declines.” Inflation in advanced economies is forecast to drift lower but remain above 2 percent targets in several large jurisdictions, keeping central banks cautious about rate cuts. The United States, United Kingdom, and Japan show varied inflation persistence and labor market tightness, complicating any coordinated policy pivot.
Emerging Markets and Developing Regions
Emerging markets and developing economies are projected to grow faster than advanced peers, though that aggregate masks significant differences. China’s growth outlook hinges on property sector stabilization and the effectiveness of fiscal support. India’s robust expansion is underpinned by investment and a favorable demographic profile. Commodity exporters in Latin America and Sub Saharan Africa face headwinds from softer global demand and currency depreciation, which feeds through to higher import inflation. Central and Eastern Europe are navigating trade disruptions linked to tariff shocks and supply chain reconfigurations. Middle East and North Africa growth is shaped by oil price trajectories and geopolitical risk.
Low Income and Vulnerable Regions
Low income countries confront a toxic combination of elevated debt burdens, commodity dependence, and limited fiscal buffers. Many are at high risk of debt distress, with debt service consuming a rising share of government revenues and crowding out essential spending. Inflation remains stubbornly high, eroding purchasing power and complicating monetary policy trade offs. External financing conditions have tightened sharply, raising rollover risks for sovereigns and limiting access to concessional funding. Climate shocks and food insecurity add further stress. The IMF’s forecasts for these regions carry exceptionally high uncertainty.
| Region | GDP Growth (%) | Inflation (%) |
|---|---|---|
| Advanced Economies | 1.5 | 2.4 |
| Emerging Markets & Developing Economies | 4.0 | 5.2 |
| Euro Area | 0.8 | 2.1 |
| Sub-Saharan Africa | 3.6 | 6.8 |
| Low-Income Countries | 4.8 | 8.5 |
Global Risks, Downside Scenarios, and Uncertainty Metrics

The IMF’s baseline sits on top of a distribution of possible outcomes, and the tail risks lean heavily to the downside. Scenario analysis quantifies the impact of plausible shocks. A synchronized tightening of financial conditions could shave 0.5 percentage points off global growth. A sustained commodity price spike would lift inflation and force central banks to keep rates higher for longer. The IMF’s world trade uncertainty index now stands roughly seven times higher than it did in October 2024, surpassing the peaks observed during the pandemic. It reflects the disruptive effects of the April 2025 tariff shocks. Unlike the pandemic, where uncertainty had a foreseeable end once vaccines rolled out, current policy uncertainty stems from unpredictable trade measures and lacks a clear resolution path.
Supply chain disruptions have returned to the forefront, resembling pandemic era breakdowns in severity but driven this time by trade policy rather than health restrictions. Firms report difficulties sourcing inputs, longer lead times, and rising logistics costs. All of which compress margins and slow production. The unpredictability of tariff policy exacerbates planning challenges, encouraging firms to delay investment and diversification decisions until the policy environment stabilizes. That wait and see behavior itself becomes a drag on growth, amplifying the economic cost of uncertainty beyond the direct tariff burden.
Five major risks underpin the IMF’s downside scenarios:
- Geopolitical tensions that disrupt energy flows or trigger broader sanctions
- Commodity volatility driven by supply shocks or demand surprises
- Financial vulnerabilities in highly leveraged sectors or fragile sovereign balance sheets
- Supply chain fragility from trade policy shifts and inadequate redundancy
- Market stress episodes that tighten credit conditions and erode confidence
Monetary and Fiscal Policy Responses in the IMF Outlook

Central banks remain in a delicate balancing act. Policy rates have been raised by hundreds of basis points across advanced and many emerging economies, pushing borrowing costs to multi year highs. The IMF acknowledges that inflation has moderated from its peaks. But core inflation and services prices remain sticky, keeping central banks wary of premature easing. The baseline assumes policy rates will stay elevated through much of 2025 before gradual cuts begin in 2026, contingent on inflation returning convincingly toward target. Any renewed inflation pressures from commodity shocks or wage spirals would delay that pivot and risk tipping economies into outright contraction.
Fiscal policy faces its own constraints. Many governments emerged from the pandemic with sharply higher debt ratios. Rising interest rates have increased debt service burdens. The IMF recommends credible consolidation plans that stabilize debt to GDP ratios over the medium term, targeting primary balance improvements measured in percentage points of GDP. Yet fiscal tightening risks compounding the demand drag from monetary policy, especially in economies where private sector balance sheets are weak. The challenge is to rebuild fiscal space without strangling the recovery, a needle that few governments have threaded successfully in past cycles.
Structural reforms offer a third lever. The IMF emphasizes labor market flexibility, product market competition, and investment in digital and green infrastructure as ways to lift potential growth and ease supply constraints. These reforms take years to bear fruit. But front loading them can improve confidence and attract private investment. The current environment of elevated uncertainty makes bold reform agendas politically difficult, yet the cost of inaction, persistent low growth and recurring crises, may be higher still.
Public Debt, Sovereign Vulnerabilities, and Sustainability Metrics
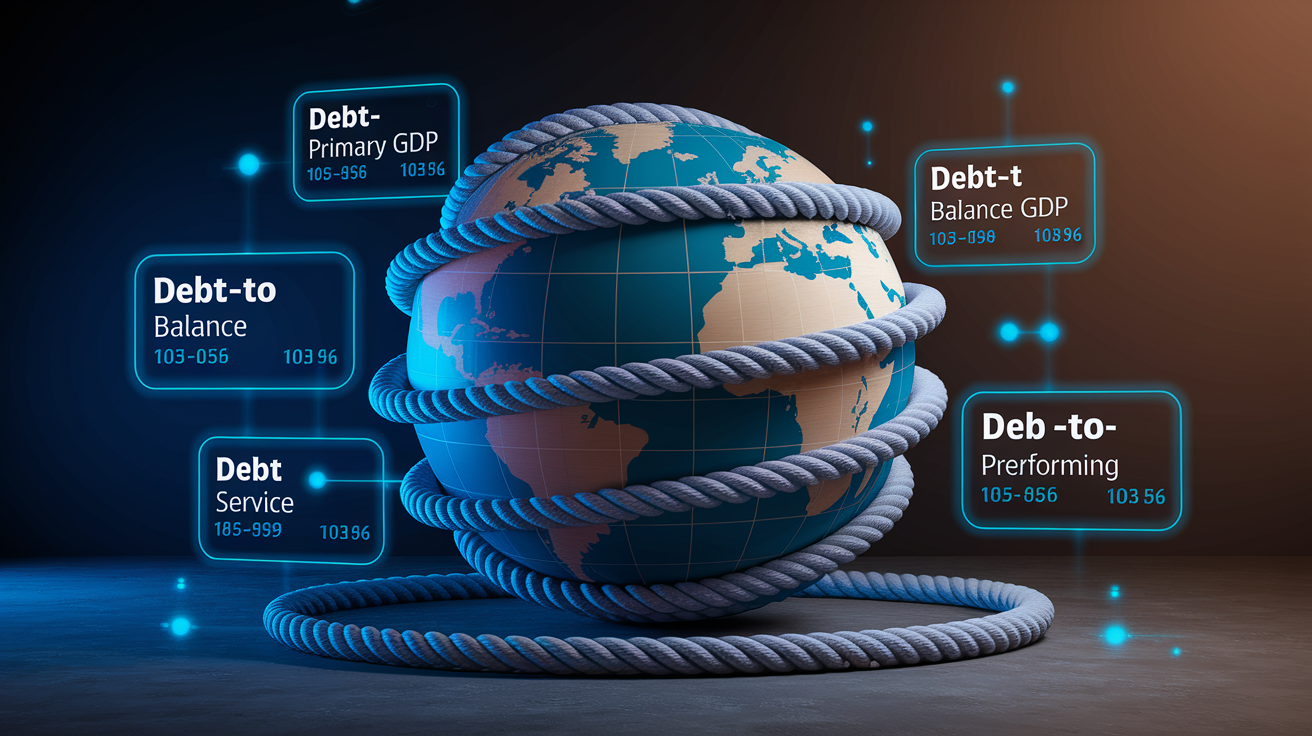
Public debt ratios remain elevated across income groups. The combination of higher interest rates and slower nominal GDP growth has worsened debt dynamics. Advanced economies carry debt to GDP ratios well above pre pandemic levels. Many emerging markets face even steeper burdens. The IMF’s debt sustainability analysis examines whether countries can meet their obligations without drastic fiscal adjustments or default, using indicators such as the primary balance needed to stabilize debt, rollover risk, and sensitivity to interest rate and exchange rate shocks.
Sovereign vulnerabilities are most acute in low income and commodity dependent countries, where debt service consumes a rising share of revenues and access to external financing has dried up. Nonperforming loan ratios in the banking sector signal stress in the real economy. Governments with weak tax bases struggle to generate the revenues needed for consolidation. The Spring 2025 analysis highlighted financing conditions as a key stress factor. Even modest increases in borrowing costs can push vulnerable sovereigns into unsustainable territory, triggering capital flight and deepening the crisis.
| Debt Metric | Description | IMF Use |
|---|---|---|
| Debt-to-GDP Ratio | Total public debt as percentage of annual GDP | Headline indicator of fiscal burden |
| Primary Balance Target | Budget balance excluding interest payments, expressed as % of GDP | Determines stabilization path |
| Debt Service Ratio | Annual interest and principal payments as % of revenue | Measures rollover and liquidity risk |
| Nonperforming Loans (NPL) Ratio | Share of bank loans in default or near-default | Signals banking sector stress and contingent liabilities |
Trade Dynamics, Tariff Shocks, and Global Supply Chain Outlook

On April 2, 2025, a day dubbed “Liberation Day,” the United States imposed the largest tariff increase in modern history, sending shockwaves through global trade. Within a week, a 90 day freeze on further tariff hikes was announced, though the freeze explicitly excluded China. Under the freeze, EU goods face a 10 percent tariff, down from the 20 percent rate announced on April 2 but still far above the pre shock average of 1.34 percent. Tariffs on Chinese products were raised to 145 percent, effectively locking much Chinese production out of the US market. These measures fragmented supply chains, raised costs for importers, and injected severe uncertainty into corporate planning. The IMF’s world trade uncertainty index spiked to levels seven times higher than in October 2024 and exceeded pandemic peaks.
Supply Chain Impacts Relative to Pandemic Disruptions
The current wave of supply chain disruption shares surface similarities with the pandemic era. Ports congested, lead times stretched, inventories misaligned. But the underlying causes differ sharply. Pandemic disruptions stemmed from lockdowns, labor shortages, and demand whiplash, all of which had a foreseeable endpoint once vaccines rolled out and economies reopened. Today’s disruptions are policy driven, rooted in unpredictable tariff announcements and retaliatory measures. Firms can’t simply wait for a vaccine. They must navigate a shifting tariff landscape with no clear resolution timeline. That unpredictability discourages the long term sourcing and investment decisions needed to rebuild resilient supply chains, leaving firms in a reactive posture that perpetuates inefficiency and cost inflation.
Six factors are shaping the global trade forecast and supply chain outlook:
- Tariffs and trade barriers that raise costs and redirect flows
- Uncertainty around future policy, which delays investment and sourcing decisions
- Shipping costs elevated by longer routes and insurance premiums
- Sanctions regimes that fragment trade networks and complicate compliance
- Demand conditions influenced by monetary tightening and consumer confidence
- Inventory cycles as firms oscillate between stockpiling and destocking in response to policy shifts
Scenario Modeling, Forecasting Tools, and Data Revisions

The IMF builds its forecasts using a blend of structural models, statistical techniques, and judgment informed by country desk expertise. Each World Economic Outlook release identifies the data vintage and model version, ensuring transparency about what information was available when the projections were finalized. Revisions between releases reflect new data, policy changes, and reassessments of structural parameters. The October 2025 update incorporated the tariff shocks of April and their effects on trade, uncertainty, and investment, leading to the 0.5 percentage point downward revision to 2025 global growth compared with January.
Scenario analysis supplements the baseline by quantifying the impact of alternative assumptions. Downside scenarios typically model shocks such as commodity price spikes, financial stress, or geopolitical escalation, each calibrated to historical precedents or stress test frameworks. Upside scenarios explore faster disinflation, stronger productivity gains, or policy surprises that boost confidence. The IMF publishes scenario fan charts alongside the baseline, illustrating the range of plausible outcomes and the associated probabilities. This probabilistic framing reminds users that forecasts are conditional and that tail risks deserve attention even if they aren’t the modal outcome.
Four key modeling components underpin IMF forecasts:
- Data sources including national accounts, labor force surveys, price indices, and financial market data collected by country desks and international databases
- Assumptions about policy rates, fiscal stances, commodity prices, and exchange rates, often informed by market pricing or stated government plans
- Scenario construction using shock calibrations based on historical episodes and stress test frameworks to assess sensitivity
- Revision cycles that update forecasts as new data arrive, policies shift, and external conditions evolve, with each release documenting changes from the prior vintage
Implications for Investors, Businesses, and Policymakers

Financial markets reacted sharply to the April 2025 tariff announcements, but not in the textbook manner. US Treasury prices fell rather than rising, defying the usual flight to safety pattern seen during risk off episodes. Investors sold government bonds, pushing yields higher and signaling concerns about fiscal sustainability, inflation persistence, or both. Equity markets exhibited volatility comparable to the early days of the pandemic, with sharp intraday swings and sector rotations as investors reassessed earnings outlooks under the new tariff regime. The IMF’s forecasts suggest that elevated policy uncertainty will keep volatility elevated, discouraging long duration bets and favoring liquid, diversified positions.
For businesses, the outlook demands scenario planning and operational flexibility. Investment decisions are being postponed or scaled back as firms wait for greater clarity on trade policy and demand conditions. Supply chain managers face the challenge of balancing efficiency against resilience, knowing that the lowest cost sourcing may no longer be reliable. Capital expenditure plans are being stress tested against downside growth scenarios. Firms with heavy exposure to tariff affected sectors are exploring geographic diversification or product pivots. The uncertainty itself is a cost, reducing the present value of long term projects and encouraging a short term, wait and see posture that can become self reinforcing.
Policymakers confront difficult trade offs. Central banks must weigh the risk of entrenched inflation against the danger of overtightening into a slowdown. Fiscal authorities are squeezed between the need to support fragile recoveries and the imperative to stabilize debt ratios. Structural reform agendas compete for political bandwidth with crisis management, yet the IMF’s analysis underscores that the medium term growth outlook hinges on productivity gains that only reforms can deliver. The baseline forecast assumes a gradual normalization of conditions. But that path is narrow, and the policy margin for error has shrunk.
Accessing IMF Reports, Data Tables, and Downloadable Resources

The full World Economic Outlook report, including the October 2025 update and all associated annexes, is available as a downloadable PDF from the IMF’s public data portal. Readers seeking specific country or regional projections can access interactive tables that allow filtering by geography, indicator, and time period. Executive summaries distill the headline messages into a few pages. Methodological appendices explain modeling choices, data sources, and the treatment of forecast uncertainty.
For researchers and analysts who need to build custom views or conduct their own scenario analysis, the IMF publishes the underlying WEO database in CSV and Excel formats. These datasets include historical series stretching back at least three to five years, alongside the full forecast horizon through 2027. Chart packs and slide decks are also available, designed for presentations and media use. All resources are updated with each release. The IMF maintains an archive of prior vintages so users can track how forecasts have evolved and assess the track record of revisions over time.
Four essential resource types support detailed analysis and communication:
- PDF report containing the full narrative, tables, charts, and methodology
- Executive summary offering a concise overview of key findings and policy messages
- Datasets in CSV and Excel for custom analysis, charting, and integration with other data
- Charts and visual tools including interactive dashboards and downloadable graphics for presentations
Final Words
In the action, the 14 October 2025 WEO update sets the headline GDP and inflation projections for 2025–2027. This piece pulled those top-line numbers, showed revision sizes, and pointed to the downloadable tables and charts.
We also ran through what’s driving the outlook, including commodity moves, policy choices, and tariff-driven trade shocks, plus which regions look stronger or weaker for growth and inflation.
Keep the main scenarios in sight and use the imf global economic outlook as a baseline for positioning and monitoring. There’s reason to stay constructive.
FAQ
Q: What is the IMF World Economic Outlook and what is the global economic outlook?
A: The IMF World Economic Outlook is the IMF’s flagship report that presents the global economic outlook, offering headline GDP and inflation forecasts, baseline projections, and downloadable data for assessing growth and risk.
Q: What is the IMF economic outlook for 2026?
A: The IMF’s economic outlook for 2026 forecasts global GDP growth at about 3.0 percent per Spring 2025, with inflation and regional differences detailed across the 2025 to 2027 projection window.
Q: How often is the IMF World Economic Outlook released?
A: The IMF World Economic Outlook is released twice a year, typically in spring and autumn, with occasional interim updates or data revisions published between main releases.